Lipid profile, Apo B – Apo A1 ratio and lipoprotein(a) as risk factors in acute coronary syndrome - A case control study
Rebecca James1, Pradeep Kumar KM2*
1,2Department of Biochemistry, Government Medical College, Kozhikode, Kerala, INDIA.
Email: pradeepkothamuttath@gmail.com
Abstract Background: Cardiovascular disease is one of the leading cause of death worldwide. In India the death rates due to coronary artery diseases (CAD) are increased manifold in recent years. The present study aim to compare the levels of lipoprotein (a) [Lp (a)], apo B - apo A1 ratio and lipid profile in patients of acute coronary syndrome (ACS) with normal healthy controls. Methodology: Seventy five patients with ACS and seventy five age matched controls in the age group of 15-55 years were studied. Blood samples were taken from all the 150 subjects for the determination of Apolipoprotein A1, Apolipoprotein B, Apo B - Apo A1 ratio, Lipoprotein [a], Lipid profile and Fasting Blood Sugar. Physical Parameters (BMI, Waist circumference, Blood pressure) and associated risk factors are also determined. Results: The mean apo B – apo A1 ratio was high in cases (2.00 ± 0.78) than control (0.54 ± 0.37). The mean apo B in cases (188.16 ± 39.49) was also higher than in control group (89.48 ± 35.46). The mean apo A1 was lower in ACS cases (104.41 ± 32.13), when compared to controls (185.37 ± 48.58). The mean Lp (a) in the cases was (31.03 ± 9.15) higher than the mean Lp (a) in control group (20.63 ± 8.41). The fasting lipid profile, total cholesterol, triglycerides and LDL was also higher in cases than in control. Whereas, the HDL cholesterol in cases was lower than in control. The fasting blood sugar value was higher among cases (123.96 ± 39.86) than controls (96.41 ± 9.46). Male sex, the past history of diabetes, family history of diabetes and hypertension are some of the risk factors of ACS (p value <0.05). In this study, smoking had significant association with ACS. A family history of CAD in <55 years is a risk factor for ACS. The mean systolic BP and diastolic BP was high in cases than control. Mean BMI of cases (24.49) was higher than control group. Furthermore, the waist circumference was higher in cases (92.73) than controls (86.69). Conclusion: Apo B - apoA1 ratio and Lp (a) are significant risk markers of ACS. But this study suggests that replacement of traditional lipid values with apo B - apoA1 ratio and Lp(a) adds little to risk assessment in ACS. In northern Kerala, were most of the patients especially belong to poor economic status, total cholesterol – HDL ratio is as efficient, as the emerging risk factors, included in this study.
Key Words: LDL, HDL, Triglycerides, Coronary artery disease, BMI.
INTRODUCTION
Cardiovascular disease is the leading cause of death worldwide, and its contribution to the disease burden is expected to increase sharply. The human and economic costs of premature vascular disease are not confined to developed countries. According to the Global Burden of Disease Study, India also faces the greatest burden due to coronary artery disease (CAD). Projection on mortality rates due to CAD in India clearly indicates nearly 100% increase in the rates from 1985 to 2015. Indeed, the total number of CAD deaths from China and India equals that of the CAD deaths contributed by all developed countries put together. A marked ethnic diversity has been well documented in the prevalence of CAD, among which Indians are reported to have a higher prevalence of premature CAD.1 According to American heart association (AHA) acute coronary syndrome (ACS) is an umbrella term used to cover any group of clinical symptoms compatible with acute myocardial ischemia. Acute myocardial ischemia is the chest pain due to insufficient blood supply to the heart muscle that results from coronary artery disease (also called coronary heart disease [CHD]). ACS thus covers the spectrum of clinical conditions ranging from unstable angina to non ST elevation myocardial infarction and ST elevation myocardial infarction. These life-threatening disorders are a major cause of emergency medical care and hospitalization. Unstable angina and non-ST-segment elevation myocardial infarction are the common manifestations of this disease. The process of atherosclerosis, which is fundamental to the occurrence of cardiovascular disease is recognized as the consequence of the interplay of a plethora of genetic and environmental factors but lipoproteins remain the foundation of its pathogenesis 2. Lipoprotein (a) [Lp (a)] and apolipoproteins are included in emerging risk factors for coronary artery disease. Apolipoprotein or apoprotein is the protein moiety of a lipoprotein. Apolipoprotein A-1 is the structural protein of antiatherogenic lipoprotein, HDL. Apolipoprotein B, is the structural protein of, atherogenic lipoprotein, IDL, VLDL and LDL. So Apolipoprotein A-1 reflects the level of antiatherogenic particle and apolipoprotein B reflects the entire spectrum of proatherogenic particles. In theory, apolipoprotein B - apolipoprotein A-1 (apo-B – apo A-1) ratio could improve lipoprotein related cardiovascular risk prediction. In addition, apolipoprotein A1 is more important than HDL cholesterol for biochemical pathways that make HDL antiatherogenic including adenosine triphosphate binding cassette A1 mediated cellular cholesterol efflux, lecithin cholesteryl acyl transferase mediated maturation of HDL particles and several antioxidative process 3, 4. Lp (a) is a lipoprotein similar to LDL in lipid and protein composition, but it contain on additional protein called apolipoprotein (a). Lp (a) is very strongly associated with myocardial infarction. Indians have a higher level of Lp (a) than Western population.5 Atherosclerosis accounts for nearly all acute coronary syndrome. The role of cholesterol fractions, apolipoproteins and lipoprotein (a) in acute coronary syndromes are research topics for several studies. The present study aims to compare correlation of lipid profile, apo B – apo A1 ratio and Lp (a) as risk factors in acute coronary syndrome.
MATERIALS AND METHODS
This case control study of one year duration was conducted in the general medicine department of the Government medical college, Kozhikode. Kerala. Seventy five patients with acute coronary syndrome and seventy five age matched controls in the age group of 15-55 years were studied (n=150). An informed written consent was obtained from all the 150 participants. Case is defined as patients with first attack of acute coronary syndrome. Acute coronary syndrome is a unifying term representing a common end result - acute myocardial ischemia. It encompasses acute MI (resulting in ST elevation or non ST elevation) and unstable angina. Non ST elevation MI (NSTEMI) is established if a patient with clinical features of unstable angina develops evidence of myocardial necrosis as reflected in elevated cardiac biomarkers. Unstable angina is defined as angina pectoris or equivalent ischemic discomfort with at least one of three features. (i) it occurs at rest (or with minimal exertion), usually lasting >10 min, (ii) it is severe and of new onset, (iii) it occurs with a crescendo pattern (i.e., distinctly more severe, prolonged, or frequent than previous 3.
Inclusion Criteria for Cases
The patients those who fulfill the definition of acute coronary syndrome and are not taking lipid lowering drugs were included in the study.
Inclusion Criteria for Control
Control is defined as age matched apparently healthy persons not fulfilling the definition of acute coronary syndrome. The control was selected from the bystanders those who are genetically unrelated to the same patient taken as case and patients admitted with an unrelated entity to acute coronary syndrome.
Physical Parameters and Associated Risk Factors
The physical parameters determined includes BMI, Waist circumference and Blood pressure. The data related to the associated risk factors were collected from the study subjects by using questionnaires and it includes age, sex, other comorbid conditions (diabetes mellitus, hypertension, etc.,) life style, dietary habits, family history of myocardial infarction, hypertension and diabetes mellitus.
Biochemical Assays
Blood samples were taken from all the 150 subjects for biochemical assays and following parameters were assayed. Apolipoprotein [A1], Apolipoprotein [B] and Lipoprotein [a] were quantitatively determined by turbidimetric immunoassay method. Lipid profile were determined by enzymatic method (Cholesterol, Triglycerides and LDL). Whereas, precipitation method was adopted for the determination of HDL. Fasting Blood Sugar was also determined by enzymatic method.
Statistical Analysis
Statistical analysis of sociodemographic and biochemical parameters between the cases and controls were done using SPSS software program version 15. The quantitative variables were analyzed by using ‘t’ test and qualitative variables using Pearson’s Chi Square test.
RESULTS
I) Physical Parameters
The results of physical parameters such as BMI, systolic blood pressure, diastolic blood pressure and waist circumferences are summarized in table 1.
Table 1: The mean, standard deviation, odds ratio and p value of the physical parameters
|
Study group |
Mean |
Standard deviation |
Odds ratio |
p value |
BMI |
Case |
24.41 |
2.49 |
9.894 |
<.05 |
Control |
20.53 |
2.46 |
Systolic BP |
Case |
148.77 |
29.47 |
15.71 |
<.05 |
Control |
115.15 |
5.91 |
Diastolic BP |
Case |
95.57 |
13.13 |
11.3 |
<.05 |
Control |
77.01 |
4.09 |
Waist
Circumference |
Case |
92.73 |
5.98 |
8.73 |
<.05 |
Control |
86.69 |
4.64 |
Blood pressure
The mean systolic BP were 148.77 and 115.15 for cases and controls respectively. Mean diastolic BP for cases were 95.57 and for controls were 77.01. Odds ratio for systolic BP was 15.7 with p value <0.05. Odds ratio for diastolic BP was 11.3 with p value < 0.05.
Body Mass Index (BMI)
The mean BMI for cases was 24.41 and for control it was 20.53. Odd ratio is 9.894 and p value is <0.05.
Waist circumference
The mean waist circumferences were 92.73 and 86.69 for case and control groups’ respectively. Odds ratio is 8.73 with p value <0.05.
II) Sociodemographic Features
Age
The mean age were 49.28 and 51.76 respectively for cases and controls. The p value for the age group was 0.011. Group wise distribution of age in cases and control are shown in the table.2
Table 2: Age group wise distribution of cases and control
Age group |
Cases |
Controls |
25-34 |
2 (2.7%) |
1 (1.3%) |
35-44 |
15 (20%) |
11 (14.7%) |
45-55 |
58 (73%) |
63 (84%) |
Gender: Of the 150 subjects studied, 124 (82.7%) were males and 26 (17.3%) were females. (Table 3).
Table 3: The male and female distribution of the study groups
SEX |
CASES |
CONTROL |
MALE |
59 (78.7%) |
65 (86.7%) |
FEMALE |
16 (21.3%) |
10 (13.3%) |
Occupation and Socioeconomic Status
The occupation of 64% (48) of cases and 66.7% (50) of the control group were unskilled work. The Pearson Chi Square test value for occupation is 0.166 and p value 0.997. 92% of cases and 92% of controls belong to Below Poverty Level (BPL) group. The p value is 1.000. Odds ratio calculated is 1.000. The details are given in table 4.
Table 4: Occupational wise distribution of study groups
Occupation |
Cases |
Control |
Unemployed |
2 (2.7%) |
2 (2.7%) |
House hold work |
4 (5.3%) |
4 (5.3%) |
Unskilled |
48 (64%) |
50 (66.7%) |
Skilled |
17 (22.7%) |
15 (20%) |
Business |
4 (5.3%) |
4 (5.3%) |
Past History
In the study group, 39 cases (52%) and 5 controls (6.67%) were hypertensive. 36 (48%) cases and 10 (13.33%) controls were diabetic. Pearson Chi square value for past history of hypertension is 14.01 with p value <0.05 and that for past history of Diabetes is 6.10 with p value <0.05. The details are provided in table 5.
Table 5: The details of the past history of hypertension and diabetes in the study groups
Past history |
Case |
Control |
Yes |
No |
Yes |
No |
Hypertension |
39 (52.0 %) |
36 (48 %) |
5 (6.67 %) |
70 (93.33 %) |
Diabetes |
36 (48 %) |
39 (52 %) |
10 (13.33 %) |
65 (86.67 %) |
Family History
Out of the 75 cases studied, 54 (72%) had a positive family history of hypertension. Out of the 75 controls studied, 18 (24%) also had a positive family history of hypertension (Table 6). P value assessed by Pearson Chi square test is < 0.05. The Odds ratio calculated for family history of hypertension is 8.143.
Table 6: The details of family history of hypertension in the study groups
Family history of hypertension |
Cases |
Control |
Yes |
54 (72%) |
18 (24%) |
No |
21 (28%) |
57 (76%) |
Regarding family history of diabetes, 48(64%) participants from the case group and 24 (32%) participants from controls groups had a positive family history of diabetes mellitus (Table 7). P value is <0.01. The Odds ratio is 3.778.
Table 7: The details of family history of diabetes mellitus in the study groups
Family history of diabetes mellitus |
Cases |
Control |
Yes |
48 (64%) |
24 (32%) |
No |
27 (36%) |
51 (68%) |
Out of the 75 cases studied, 33 (44%) had positive family history of CAD. Out of which 62.7% had occurrence of CAD in <55 years. Among the control group 36 (48%) had positive family history of CAD, but 92% had family history of CAD in >55 years. P value by Pearson Chi square test is <0.05. Odds ratio for family history <55 years is 6.85.
Addictions
63 cases and 38 controls were smokers (Table 8). Odd ratio for smoking was 5.112. Pearson Chi square test p value is <0.05.
Table 8: The details of addictions in the study groups
Smoking |
Cases |
Control |
Current user |
57 (76%) |
6 (8%) |
Previous user |
6 (8%) |
32 (42.7%) |
Not a user |
12 (16%) |
37 (49.3%) |
Current alcohol user constitute 47 cases and 19 controls. Odds ratio is 0.690 with p value 0.497.
Diet: Only 2 cases and 2 controls were strict vegetarians. p value 0.560.
Physical Activity
Out of 75 cases, 48 were very active, 17 moderately active and 10 not active. Among the control group, 48 very active, 18 moderately active and 9 were sedentary. The p value was 1.000.
III) Biochemical Parameters
Apolipoproteins and their ratio
The mean of apo B – apo A1 ratio was high in cases. 2.00998 (SD = 0.78805) than control 0.54469 (SD = 0.37899). The Odds ratio was 11.725 (p value <0.05) which clearly indicates apo B – apoA1 ratio is a significant risk marker of acute coronary syndrome. The mean of apo B in cases (188.165) were higher than in control group (89.480). The Odds ratio for apo B was 11.677 (p value <0.05). The mean apo A1 was lower in cases (104.41), when compared to controls (185.37). The Odds ratio for apo A1 in the study group is 5.083 (p value <0.05) (Table 9, Figure 5 and 6).
Lipoprotein (a)
The mean Lp (a) in the cases was 31.03 (SD = 9.15) higher than the mean Lp (a) in control group 20.63 (SD = 8.41). The Odds ratio for Lp (a) is 11.714 (p value <0.05)
Lipid profile
Considering the fasting lipid profile, the mean of total cholesterol, triglycerides, LDL was higher in cases than in control. The mean HDL cholesterol in cases was lower than in control. The Odds ratio was different for each biochemical parameter in the fasting lipid profile. The Odd’s ratio was highest for LDL cholesterol 7.825 (p value <0.05), then total cholesterol, 5.954 (p value <0.05) followed by HDL cholesterol 4.955 (p value <0.05) and lastly triglycerides 1.659 (p value <0.05) (Figure 1 & 2)
Table 9: The mean, standard deviation, odds ratio and p value of the biochemical parameters
|
Study group |
Mean |
SD |
Odds ratio |
p value |
APO-B |
Case |
188.165 |
39.496 |
11.677 |
<.05 |
Control |
89.48 |
35.469 |
APO-A1 (mg/dl) |
Case |
104.41 |
32.13 |
5.083 |
<.05 |
Control |
185.37 |
48.58 |
APO-B/APO-A1 |
Case |
2.00998 |
0.78805 |
11.725 |
<.05 |
Control |
0.54469 |
0.37899 |
LP(a) (mg/dl) |
Case |
31.03 |
9.15 |
11.714
|
<.05 |
Control |
20.63 |
8.41 |
Total cholesterol (mg/dl) |
Case |
222.29 |
52.56 |
5.954 |
<.05 |
Control |
173.15 |
25.95 |
Triglycerides (mg/dl) |
Case |
183.37 |
61.20 |
1.659 |
<.05 |
Control |
148.17 |
41.86 |
HDL-C (mg/dl) |
Case |
35.47 |
8.42 |
4.955 |
<.05 |
Control |
40.81 |
6.91 |
LDL-C (mg/dl) |
Case |
140.23 |
46.28 |
7.825 |
<.05 |
Control |
106.49 |
14.04 |
TC/HDL-C |
Case |
6.4257 |
1.8688 |
11.951 |
<.05 |
Control |
4.5327 |
2.4835 |
FBS (mg/dl) |
Case |
123.93 |
39.86 |
9.418 |
<.05 |
Control |
96.41 |
9.46 |
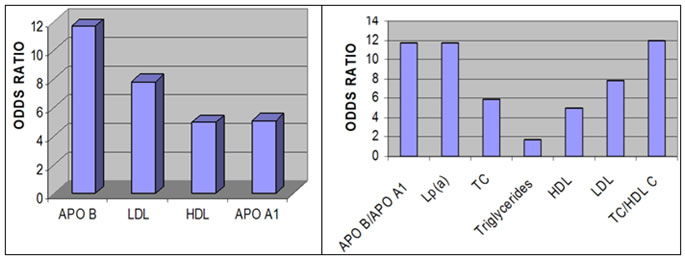
Figure 1: The odds ratio of Apo B, LDL, HDL and Apo A1 Figure 2: The odds ratio of Apo B-Apo A1 ratio, Lp(a),
Total cholesterol, Triglycerides, HDL, LDL and TC-HDL ratio.
Fasting blood sugar
The fasting blood sugar value was higher among cases [123.96 (SD = 39.86)] than controls [96.41 (SD = 9.46)].The odds ratio was 9.418 (p value <05) (Table 9). This shows an impaired fasting blood sugar, a significant risk factor of acute coronary syndrome.
DISCUSSION
The results obtained for apo A1 and apo B separately, indicates that a low apo A1 and high apo B levels are risk predictors in ACS. Whereas, the apo B and apo B – apo A1 ratio has almost same risk estimate for. The odds ratio of apo B is much higher than LDL. This may be because apo B includes other atherogenic lipoproteins like VLDL and chylomicrons. The relative risk for apoB-apoA1 ratio was 3.81 (p value <.001) in a case control study by Parish et al., 6 conducted among 3510 acute myocardial infarction (MI) patients and 9805 controls. This study concluded that this ratio encapsulated almost all the predictive power than other lipid fractions. For LDL related factor, apo B the association with acute myocardial infarction was strongly with relative risk 2.66 (p value<.01). The apo A1 is strongly negative for acute MI. The relative risk was 2.33 (p value <.01). Comparing among these parameters apolipoprotein ratios were more informative about the risk. A case control analysis was conducted by Wilm et al., 7, to evaluate whether the apo B –apo A1 ratio is associated with future CAD events independent of traditional lipid measurements, and this study concluded that the apo B –apo A1 ratio was associated with future CAD events, with odds ratio 2.64 (p value <.001). However it did no better than lipid values in discriminating between CAD cases and controls. A study by McQueen et al., 8 a large standardized case control study of acute MI in 12461 cases and 14637 controls in 52 countries, the following were the findings. The apo B-apo A1 ratio had the highest population attributable risk (PAR) and the highest odds ratio 1.59 (p value <.001). The hazard ratio for the apo B –apo A1 ratio was 3.01 (p value <.001) in a prospective cohort study by Paul et al., 9. The Lp(a) risk estimate reveals that it is also a significant risk factor for acute coronary syndrome. In the study of Hoogeven et al., 10 mean Lp(a) in cases was 12.65+/-9.4mg/dl and in controls 9.15+/-7.33 mg/dl. The odds ratio was 1.14 (p<.042). A study in CAD patients before coronary angiography, the odds ratio for Lp(a) was 2.47 (p value<.001) 11. When TC to HDL-C ratio considered, the Odds ratio was 11.951 (p value <0.05) which clearly indicate that this simple measurement of TC/HDL-C ratio is a strong risk marker as Lp(a) and apo(B) apoA1 ratio. In our medical college set up where almost all the patients belong to poor socioeconomic status, the measurement of TC to HDL ratio measurement is much cost effective than Lp(a) or apoB-apoA1 ratio measurement. Several studies reported that the total cholesterol-HDL ratio had the highest odds ratio. In the present study also odds ratio for total cholesterol-HDL ratio is higher than other lipid fractions.6-9 Apo A1 had almost the same risk estimate as HDL fraction in all the studies mentioned other than the INTERHEART study.8 The present study is consistent with the above conclusion. But in the case of apo B versus LDL the two previous reports, 6, 9 revealed that apo B is more significant than simple LDL value. In the present study the apo B level is more significant than LDL in risk estimation of acute coronary syndrome. Among the biochemical parameters studied raised apoB-apoA1 ratio, Lp(a), fasting lipid profile are all risk factors. Comparing among these parameters, apoB-apoA1 ratio, Lp(a) and total cholesterol-HDL ratio have almost equivalent risk estimate. Among the fasting lipid profile, LDL–C has the highest odds ratio and Triglycerides the least. ApoB - ApoA1 ratio and Lp(a) measurement is not cost effective when compared to TC- HDL-C ratio, as they all have almost the same odds ratio. In our medical college set up prefer TC-HDL-C ratio to apo (B)-apoA1 ratio and Lp(a). Apo B is more significant than LDL in acute coronary syndrome. Considering the associated risk factors, male sex is definitely a significant risk factor. Occupation and socioeconomic status are not significantly associated with acute coronary syndrome (p value >0.05). The past history of diabetes and hypertension are obviously risk factors of ACS (p value <0.05). It is well established that diabetes mellitus is an independent predictor of adverse cardiovascular events, regardless of age 12-13. In this study smoking has significant association with acute coronary syndrome. But current alcohol use is not a significant risk factor for ACS (p value >0.05). Family history of diabetes, hypertension and family history of CAD in <55 years are significant risk factors for acute coronary syndrome (p value 0.05). The quantitative variables studied revealed the following findings. Mean systolic BP and diastolic BP is high in cases than control. Odds ratio for systolic BP is more than diastolic BP. Hypertension is a significant risk factor for acute coronary syndrome (p value <0.05). Mean BMI of cases is higher than control. The Odds ratio is 9.894 with p value <0.05. Waist circumference is higher in cases than controls. The Odds ratio is 8.73 and p value <0.05. So obesity is significantly associated with acute coronary syndrome. In conclusion, Apo B - apoA1 ratio and Lp(a) are significant risk markers of acute coronary syndrome. But this study suggest that replacement of traditional lipid values with apo B - apoA1 ratio and Lp(a) adds little to risk assessment in acute coronary syndrome. Especially in northern Kerala, were most of the patients belong to poor economic status, total cholesterol – HDL ratio is as efficient, as the emerging risk factors, included in this study.
REFERENCE
-
John JP, Kastelein, Wilm A.Vandersteeg, Michael Jaffney, Nilo B Cater. Lipids, apolipoproteins and their ratios in relation to cardiovascular events with statin treatment. Circulation. 2008; 117: 3002-3009
-
Deepa R, Aravind K and Mohan V. Diabetes and risk factors for coronary artery disease. Current Sciences, 2002 (12): 1497.
-
Fauci AS, Kasper DL, Longo DL, Braunwald E, Hauser SL, Jameson JL, Loscalzo J. Harrison’s Principles of Internal Medicine. 17th Edition, Vol. II, McGraw-Hill Professional. p.1505-09.
-
Wilm A, Vander Steeg, Mathijs Boekholdt, Karim EL, Erik SG, Stroes, Majinder S. Sandhu. Role of apolipoprotein B – apolipoprotein A1 ratio in cardiovascular risk assessment. A case-control analysis in EPIC-Norfolk. Ann Intern Med. 2007; 146: 640-648.
-
Vasudevan DM, Sreekumari S. Text Book of Biochemistry, 5th Edition, p148-163.
-
Parish S, Peto R, Palmer A, et al., The joint effects of apolipoprotein B, apolipoprotein A1, LDL cholesterol and HDL cholesterol on risk of acute myocardial infarction. European Heart Journal. 2009; 30: 2137-2146.
-
Wilm A, Vander S, Mathijs B, Karim EL, Erik SG, Stroes, Majinder S. Sandhu. Role of apolipoprotein B – apolipoprotein A1 ratio in cardiovascular risk assessment. A case-control analysis in EPIC-Norfolk. Ann Intern Med. 2007; 146: 640-648.
-
McQueen MJ, Hawken S, Wong X, Ounpun S, et al., Lipids, lipoproteins and apolipoproteins as risk markers of myocardial infarction in 52 countries (the INTERHEART study) a case control study Lancet 2008 ;372:224-233.
-
Ridker PM, Rifai N, Cook NR, Bradwin G, Buring JE. Non-HDL cholesterol, Apolipoproteins A-1 and B100, standard lipid measures, lipid ratios and CRP as risk factors for cardiovascular disease in women. JAMA, 2005; Vol.294: 326-33.
-
Hoogeveen RC, Gambhir JK, Kay T, Timball, Vaduganathan M, Rao RS. Evaluation of Lp(a) and other independent risk factors for CHD in Asian Indians and their USA counterparts. Journal of Lipid Research 2001; 42: 631-638.
-
Tsimikas S, Emmanouil S, Brilakis, Miller ER, Lennon RJ, Kornman KS, Witztum JS, Berger PB. Oxidised phospholipid, Lp(a) Lipoprotein and coronary artery disease. N Engl J Med. 2005; 353: 46-57.
-
Kim HL, Kang SH, Yoon CH, Cho YS, Youn TJ, Cho GY, Chae IH, Kim HS, Chae SC, Cho MC, Kim YJ, Kim JH, Ahn Y, Jeong MH, Choi DJ; Other Korea Acute Myocardial Infarction Registry (KAMIR) and Korea Working Group on Myocardial Infarction (KorMI) Investigators. Differential prognostic impacts of diabetes over time course after acute myocardial infarction. J Korean Med Sci. 2013;28 (12):1749-55.
-
Lin MJ, Chen CY, Lin HD, Wu HP. Impact of diabetes and hypertension on cardiovascular outcomes in patients with coronary artery disease receiving percutaneous coronary intervention. BMC Cardiovasc Disord. 2017;17(1):12.
 Home
Home This work is licensed under a Creative Commons Attribution-NonCommercial 4.0 International License.