 Home
HomeOfficial Journals By StatPerson Publication
|
Table of Content - Volume 12 Issue 2 - November 2019
P Mohanalakshmi1*, N Muninathan2
1Associate Professor, Department of Biochemistry, SriMuthukumaran Medical College and Research Institute, Chikkarayapuram, Chennai, Tamil Nadu, INDIA. 2Research Scientist, Department of Research, Meenakshi Medical College Hospital and Research Institute, Meenakshi Academy of Higher Education and Research, Kanchipuram-631552, Tamil Nadu, INDIA. Email: pmona25@yahoo.co.in
Abstract Background: The present study was carried out to assess gender differences in certain biochemical variables in Chronic kidney disease patients with Diabetes mellitus and normal individuals. Methods and Materials: The study was conducted at a tertiary care hospital, Chennai. The study population consists of 20 CKD patients with diabetes mellitus and 20 healthy subjects as controls. The following biochemical variables like bun, creatinine, Total cholesterol, triglycerides, low density lipoprotein, high density lipoprotein, VLDL, blood glucose fasting and postprandial blood glucose were analysed using commercially available kits. Result: Gender wise comparison between control male and female showed no significant.(P<0.05) .Gender wise comparison between CKD patients with diabetes mellitus and control group showed that all variables of the control group and certain variables like bun , lipoprotein (a) ,triglycerides and high density lipoprotein in CKD patients with diabetes mellitus were not statistically significant.(P>0.005). Gender wise comparison between CKD patients with diabetes mellitus showed that variables like fasting blood glucose, postprandial blood glucose, total cholesterol and low density lipoprotein were greater in females than males. (P<0.001). In males creatinine values was greater than females (P<0.05). Conclusion: Gender wise comparison between CKD patients with diabetes mellitus and control group was not significant except for certain variables like bun, lipoprotein (a), triglycerides and high density lipoprotein. Female CKD patients with diabetes mellitus had increased levels of fasting blood glucose, postprandial blood glucose, total cholesterol and low density lipoprotein than males whereas males had increased levels of creatinine indicating the effect of gender on the progression of the disease. Key Word: Chronic kidney disease, Type 2 Diabetes mellitus, Total cholesterol, High density lipoprotein.
INTRODUCTION Chronic kidney disease (CKD) is a major health problem. Chronic kidney disease(CKD) can be detected by estimating Glomerular filtration rate (GFR).(1)CKD usually increases with age and therefore is a major risk factor in elderly individuals. Studies indicate that women are less prone to the risk of CKD.2 CKD patients with diabetic nephropathy constitute a major population of patients treated with dialysis and transplantation. It is found that during the course of the disease, these patients with CKD develop severe atherosclerotic complications and vascular disease resulting in higher mortality and morbidity rate than nondiabetic patients.3 Cardiovascular disease are a greater risk for women than men and is one of the major cause of death in women .The risk factors for cardiovascular disease ae high cholesterol, high triglycerides, low HDL, diabetes, hypertension, gender and cigarette smoking.4 The incidence of coronary artery disease is much lower in young women than men of the same age group. As age increases the risk equalizes for both the sexes5
MATERIALS AND METHODS The study was conducted over a period of two months. The study was conducted among subjects attending Nephrology Department at a tertiary care centre, Chennai. The study includes 40 subjects in the age group of 40 to 60 years. They were divided into 2 groups. Group 1 composed of normal healthy controls. Group 2 consisted of subjects with Chronic kidney disease with type 2 Diabetes mellitus. Each group had 10 males and 10 females. All patients underwent a full medical history that included age, family history of diabetes, hypertension, coronary artery disease , Chronic kidney disease, duration of Chronic kidney disease, type of dialysis ( Peritoneal or Hemodialysis), duration of Diabetes, treatment history for diabetes, smoking and alcohol, Drug history and treatment history for any other disease was collected through a standard questionnaire. Blood samples were collected after 12hours of fasting in the vacutainers for estimation of glucose, lipoprotein (a), lipid profile, Bun and creatinine. Blood samples were collected in the morning after 12 hours of overnight fasting. The samples were separated by centrifugation at 2400 rpm. Plain vacutainer is used for serum and for plasma, sodium fluoride vacutainers were used. Lipoprotein (a) was analysed in kone lab 60 automated systems using commercially available kit by Latex daiichi. Lipid profile was analysed in kone lab 60 using commercially available kit by randox. Glucose was analysed in konelab 60 automated systems using commercially available kit by accurex. Bun and creatinine were analyzed in Kone lab 60 automated systems using commercially available kit by trace. Statistical analysis and interpretations: The biochemical study variables were described in terms of averages and interpreted between the groups and gender were done by student independent “t” test. The P- values less than or equal to 0.05 (P≤0.05) were considered as level of statistical significance. RESULTS Table 1: Comparison of gender wise age (years) between the control and CKD with diabetic subjects
The table-1 compares the two groups namely control and CKD with diabetic in respect of their ages. The mean male ages of both groups were 53.0±5.1 years and 50.3±4.9 years. Similarly, the mean female ages were 54.3±4.0 and 52.6±6.6 years. The mean age of male and females in both the group was not statistically significant.( P>0.05).
Table 2: Comparison of bio-chemical variables between control and CKD with diabetic subjects:
The table-2 states the comparison of biochemical measures between the two groups. The mean Bun of both groups was 44.6±12.5 and 44.4±14.2. The mean creatinine of control group was 3.9±0.7 and CKD with diabetic was 4.5±1.2. The mean fasting blood glucose (FBG) of control and CKD subjects were 93.0±6.6 and 147.0±19.7 respectively. The post prandial blood glucose (PPBG) of both groups in terms of means was 116.4±10.0 and 223.4± 29.9. The Lipoprotein(a) level of both groups were 69.4±4.8 and 70.1±4.4. The mean Cholesterol of control group was 234.4±6.9 and of the CKD group was 256.4±6.3. The control group’s mean TGL was 175.6±4.8 and the same of the CKD group was 184.9± 6.9. The mean HDL of both groups was 35.2±4.0 and 31.4±4.8. The mean LDL of control group was 169.9± 5.3 and the mean LDL of CKD group was 192.1±7.8. The biochemical mean differences were either statistically significant (P<0.05) or very highly significant (P<0.001). But, the Bun and lipoprotein (a) were not statistically significant (P>0.05
Table 3: Gender wise comparison within the control and CKD with diabetic subjects:
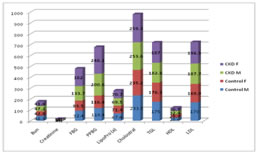
Figure 1: Comparison within the groups between the genders.
The table-3 compares biochemical measures within groups between the genders. In respect of control groups all the biochemical variables were not statistically significantly (P>0.05) between the genders. In respect of CKD with diabetic, the following variables had no change between the genders namely bun, Lipoprotein (a), TGL and HDL (P>0.05). The following variables like creatinine, FBG, PPBG, Cholesterol and LDL were differed as follows. The mean creatinine of males were 5.1±1.1 and females were 4.0±0.9. The difference between the genders was statistically significant (P<0.05). The mean FBG of male was 133.7±10.1 and female was 162.0±16.4. The mean PPBG of male was 200.3±17.9 and female was 246.1±20.5. The differences of means between the genders in respect of FBG and PPBG were statistically very highly significant (P<0.001). The mean cholesterol of male was 253.6±5.4 and female was 259.3±6.0. The difference between the genders was statistically significant (P<0.05). The mean LDLs of both the genders were 187.7± 6.4 and 196.5±6.6. The difference of mean between the genders was statistically highly significant (P<0.01). DISCUSSION Gender affects lipid parameters and is independent of age and menopausal status. In our study female CKD patients when compared to their male counterparts had increased levels of total cholesterol and LDL6. Women usually present with a different lipoprotein profile than men because the lipid profile undergoes various changes during her lifetime, which might be due to endogenous hormones estrogen and progesterone during pregnancy, the use of oral contraceptives and hormone replacement therapy at menopause.5 Studies indicate that type 2 diabetes increase the risk of CHD more markedly in women than men. Dyslipidemia due to type 2 diabetes is more pronounce in women than men. Large population base studies have observed that at the time of menopause, LDL cholesterol levels increase by 15 to 25 % and this increase is largely observed in men than women of the same age and approximates LDL cholesterol levels in women after oophorectomy. The reason might be to low estrogen levels during menopause which plays a major role in causing the adverse changes in both lipid profile and incidence of CHD.7 According to William. K the level of atherogenic lipids represent a major cardiovascular risk factor which supports our study.8 In our study female CKD patients with DM had also increased levels of fasting and postprandial blood glucose when compared to males. This might be due to increased de arrangement of carbohydrate metabolism as a result of hormonal changes.9 The risk of cardiovascular heart disease is threefold increased in women with diabetic than men of the same age group. This risk is due to additional risk factors which occur in diabetes .Studies also indicate that increase in CHD in women is after 50 years of age .The reason for this is not understood completely and might be due to multiple risk factors.10 In this study males CKD patients with diabetes mellitus had increased levels of creatinine when compared to females patients with diabetes mellitus which could be due to the difference in muscle mass. The increase in creatinine depends upon many factors like severity, time of renal injury, distribution of creatinine, its rate of production and finally its excretory rate.11
CONCLUSION There was no difference in age between male and female CKD patients with diabetes mellitus and the control group. No gender difference was observed between controls and CKD patients with diabetes mellitus. However there was gender difference in CKD patients with diabetes mellitus, males had increased levels of creatinine and females had increased levels of fasting, postprandial blood glucose, total cholesterol and LDL. Although this study highlights that gender influences certain biochemical variables , this study was conducted with a small group. The study can be extended to a larger group to so that age and gender specific reference intervals can be established.
REFERENCES
|
|||||||||||||||||||||||||||||||||||||||||||||||||||||||||||||||||||||||||||||||||||||||||||||||||||||||||||||||||||||||||||||||||||||||||||||||||||||||||||||||||||||||||||||||||||||||||||||||||||||||||||||||||||||||||||||||||||||||||||||||||||||||||||||||||||||||||||||||||||||||||||||||||||||||||||||||||||||||||||||||||
 This work is licensed under a Creative Commons Attribution-NonCommercial 4.0 International License.