 Home
Home
|
Table of Content - Volume 18 Issue 1 - April 2021
Genotype- phenotype correlations of TNF- α gene in polycystic ovarian disease (PCOS)
K Sampurna1, Bangaraiah gari Ramesh2*, Bangaraiah gari Raj0esh3, Rafi MD4, Yeyuvuri Praveen Raju5
1Associate Professor, Department of Biochemistry, Bhaskar Medical College and General Hospital, Telangana, INDIA. 2Associate Professor, 4Professor, Department of Biochemistry, {3Associate Professor, Department of Anatomy}, Surabhi Institute of Medical Sciences, Telangana, INDIA. 5Associate Professor, Department of Community Medicine, Pratima Medical College, Telangana, INDIA. Email: rameshbiochem007@gmail.com
Abstract Background: Polycystic ovarian syndrome (PCOS) is an endocrine disorder very common in women of reproductive age group. Polymorphisms in the tumor necrosis factor alpha (TNF-α) have been associated various related diseases ranging to Obesity, PCOS and infertility. In this context, we evaluated association between PCOS and three promoter single nucleotide polymorphisms of the gene TNF-α viz -238G/A (rs361525), -308G/A (rs1800629) and -1031T/C (rs1799964) respectively. Material and methods: This is inter-disciplinary study conducted in biochemistry department of a teaching medical institute by collaborating with tertiary care hospitals, and genetic diagnostic lab. In this prospective study recruited 100 PCOS patients with 100 age matched controls, we employed 3 sets of primers and screened the known single nucleotide polymorphism TNF-α gene. Apart from qualitative and quantitative evaluation, linkage disequilibrium, multifactor dimensionality reduction analysis and In-silico analysis was also performed. Results: The percentage of AA, AG and GG genotypes in patients was 32, 44, 24 while it was 25, 45 and 30 in controls respectively. Relative risk analysis of the TNF-a -238 G/A polymorphism revealed a threefold risk for the “AG” and “GG” genotypes under the codominant model of inheritance (OR= 1.11, CI= 0.49 – 2.52, p= 0.93 and OR= 1.00, CI= 0.48 – 2.17, p= 1.0 respectively). Similarly a twofold risk was also observed for the “AG+GG” genotypes under the dominant model of inheritance (OR= 2.11, CI= 0.97 – 4.69, p=1.93). When relative risk for the alleles demonstrated a twofold risk of G allele towards disease establishment (OR= 1.00, p= 0.84). Conclusions: The present study failed to implicate the role of the AG and GG genotypes, and the G allele in contributing towards establishment and progression of PCOS though further studies are warranted to establish in varied races. Keywords: PCOS; Rotterdam criteria; TNF-alpha; Cytokines; Infertility
INTRODUCTION Tumor necrosis factor alpha (TNF-α) is a potent immunomodulator and proinflammatory cytokine displaying varied functions. It plays an important role in the onset of inherited disorders related to cancers, by regulating cellular functions such as cellular proliferation, differentiation, apoptosis, inflammation, tumorigenesis and viral replication. It is produced by monocytes/macrophages, apart from other cell types1. Besides the primed components of the immune system TNF-αis produced by cells in the female reproductive tract2. TNF-α mediates its effects through two different receptors: receptor I (also TNF-α called p55 or p60) and receptor TNF-α II (also called p75 or p80). While TNF-alpha receptor I is expressed on all cell types in the body, recep TNF-α receptor II is expressed selectively on endothelial cells and on cells of the immune system: it binds to two receptors with comparable affinity3. Several polymorphisms in the promoter region of the gene TNF-α have been described1. Among the best studied the -238G /A (rs361525) and -308G /A (rs1800629) polymorphisms have been associated with an increased transcriptional activity and release TNF-α4. The present study aims to identify the association between PCOS and three promoter single nucleotide polymorphisms of the gene TNF-α viz -238G/A (rs361525), -308G/A (rs1800629) and -1031T/C (rs1799964) respectively.
MATERIAL AND METHODS The study was conducted on 100 PCOS and 100 healthy control women, recruited from patients visiting tertiary care hospital. PCOS participants were selected based on observation of oligoamenorrhea/ anovulation, clinical or biochemical evidence of hyperandrogenism and/or polycystic ovaries on ultrasonography4. Normal, unaffected, age-matched fertile women with regular menstrual cycles (interval of 28-35 days) and with normal ovaries from the same geographical region were included in the study as controls. Exclusion criteria were women with galactorhea, hyperthyroidism, any systemic disease that affects their reproductive physiology, or any medication which interferes with the normal function of the hypothalamic-pituitary-gonadal axis. Participant’s age group was in the range from 18-35yrs. The study was approved by the Institutional Ethical Committee (011/02/2015 IEC / Saveetha University Dated12-02-2015). A written informed consent was collected from all the subjects enrolled in the study. Participant’s history and other anthropometric assessments were carried out. Sample collection and requirement: Blood samples were collected from participants by venipuncture and it was processed within two hours. Then the samples were centrifuged at 3000 rpm for 10 minutes at 20ᵒc to isolate the serum and it was stored -20ᵒC until used. Molecular studies Genotyping study was carried out for modifier genes by Allele Specific-PCR and PCR based Restriction fragment length polymorphism analyses (RFLP).
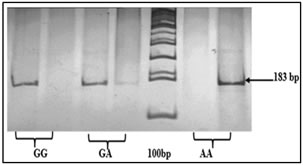
Genomic DNA Isolation 5 ml of whole blood from controls and subjects was obtained for genomic DNA isolation. In cases/subjects with insufficient amount of blood sample drawn, DNA isolation by Rapid genomic DNA extraction (RGDE) was also carried out. The isolated DNA was considered for mutational screening by PCR based SSCP and for genotyping studies, PCR based RFLP analyses was adopted for the following gene/s. DNA concentration and purity was checked on 0.8% agarose gel or by spectrophotometer. The samples were then stored at -200C for subsequent analysis. Isolation of DNA following Rapid genomic DNA extraction Genomic DNA of high quality and quantity can be obtained in the shortest time and with just 500µl of blood sample by following this protocol. Quantification of DNA DNA was quantified by measuring the absorbance values at 260 and 280nm in a NANOVIEW (GE Healthcare). The ratio of 260/280 nm was observed and the purity of DNA was checked. The isolated genomic DNA was later used for PCR-SSCP and PCR-RFLP analyses. In-vitro amplification of gene of interest by Polymerase chain reaction (PCR) Amplifying a gene of interest was done by PCR using specific primers obtained from published reports under appropriate cycling conditions of denaturation, annealing and extension in a Thermal cycler (Eppendorf, Germany). PCR-RFLP PCR-restriction fragment length polymorphism (PCR-RFLP) is one among the various popular techniques utilized for genotyping single nucleotide polymorphisms. The essence of this technique is the exploitation of the fact that SNPs and micro-indels often end up creating or abolishing restriction enzyme recognition sites. The technique involves the amplification of the target sequence containing the variation. The amplified fragment is then treated with an appropriate restriction enzyme. The presence or absence of the restriction site would result in variant fragment sizes which later can be resolved using electrophoresis. Molecular Analysis: PCR conditions followed for -308G/A, -1031T/C, -238G/A were, initial denaturation at 950C for 5 min, denaturation step at 950C for 30 sec, annealing at 580C for 30 sec, extension at 720C for 1 min for 30 cycles. Final extension was carried out at 720C for 7 min. The PCR products were subjected to RFLP with MspI enzyme (New England Biolabs) by incubating overnight at 370C which were later checked on 3% Agarose gel (Fig 1, Fig 2, and Fig 3). Primer sequences of Tumor Necrosis Factor alpha (TNF- α) gene polymorphisms
Statistical Analysis: SPSS 20.0 version was utilized. Following methods were employed.
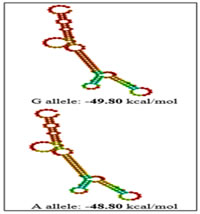
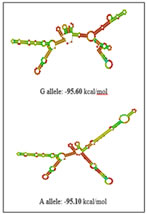
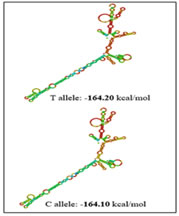
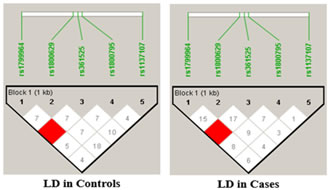
RESULTS The present study was aimed to identify the association between PCOS and three promoter single nucleotide polymorphisms of the TNF-α gene viz -238G/A (rs361525), -308G/A (rs1800629) and -1031T/C (rs1799964) The percentage of GG, GA and AA genotypes in patients was 24, 44, 32 while it was 25, 45 and 30 in controls respectively. The allele frequencies of G and A allele are 0.46 and 0.54 for patients while it was 0.48 and 0.52 for controls correspondingly. The genotype and allele frequencies did not differ significantly between the groups. The patients as well as the controls were following Hardy Weinberg Equilibrium. The genotype and the allele frequencies of the patients and controls are given in Table 7.1. Risk analysis in order to identify the role of the individual genotype, did not reveal any protective or predisposing role towards PCOS. Mendelian effect modelling also did not yield any significant outcome. The risk estimates of TNF--238G/A genotypes and alleles among the study group are given in Table 7.2.Secondary structure analysis of the pre-mRNA revealed distinct changes with the entropy being high in the variant allele (-48.80 kcal/mol) compared to wild type allele (-49.80 kcal/mol) (Figure 5). The percentage of GG, GA and AA genotypes in patients was 25, 50 and 25 while it was 23, 47 and 30 in controls respectively. The allele frequencies of G and A allele are 0.5 and 0.5 for patients whereas it was 0.47 and 0.53 for controls correspondingly. The genotype and allele frequencies did not vary between the groups. The patients as well as the controls were following Hardy Weinberg Equilibrium. The genotype and the allele frequencies of the patients and controls is given in Table 3. Risk analysis in order to identify the role of the individual genotype, did not reveal any protective or predisposing role towards PCOS. Mendelian effect modeling also did not yield any significant outcome. The risk estimates of TNF--308G/A genotypes and alleles among the study group are given in Table4 Secondary pre-mRNA structures built were showing distinct energy changes for the respective alleles of SNP with the entropy being high for the variant allele (-95.10 kcal/mol) compared to wild type allele (-95.60 kcal/mol) Figure 6. The percentage of TT, TC and CC genotypes in patients was 24, 38, 38 while it was 25, 40 and 35 in controls respectively. The allele frequencies of T and A allele are 0.43 and 0.57 for patients while it was 0.45 and 0.55 for controls correspondingly. The genotype and allele frequencies did not differ significantly between the groups. The controls were following Hardy Weinberg Equilibrium while the patients deviated from HWE. The genotype and the allele frequencies of the patients and controls are given in Table 5. Risk analysis in order to identify the role of the individual genotype, did not reveal any protective or predisposing role towards PCOS. Mendelian effect modelling also did not yield any significant outcome. The risk estimates of TNF-α-1031T/C genotypes and alleles among the study group are given in Table 6. The pre-mRNA secondary structure demonstrated a distinct change that could be observed contributing to the less stability and high entropy of the variant “C” allele (-164.10 kcal/mol) when compared to the wild type allele (-164.20 kcal/mol) Figure 7. Linkage Disequilibrium Linkage disequilibrium (LD) plot for the four variations was constructed with the help of Haploview 4.2 and D’ values are given in the Figure 8. Haploview is an application for haplotype and statistical genomic analysis for visualization of family/case-control based analyses and the program uses a two marker expectation – maximization (EM) ignoring missing data to estimate the maximum likelihood values of the four gamete frequencies, from which the D’, LOD and r2 calculations can be derived. Each square displays the amount of LD between a pair of markers. LD is the non-random association of alleles at two or more loci; not necessary on the same chromosome. The strength of the LD between two markers is given by the intensity of color of the box. In crossing areas multi -allelic D’ value corresponds to the level of recombination between two blocks. And D’ value 0 indicates maximum amount of recombination between two blocks. The two most common pair-wise measures of LD are D’ and r2,D’ is defined to be 1 in the absence of obligate recombination, declining only due to recombination or recurrent mutation. The r2 is squared correlation coefficient between the two markers, thus r2 is 1 when two markers remain undisrupted by recombination, but has a value less than 1 when an initially strong correlation has been disrupted by crossing over. The LD plots generated are listed below. The Figure 8 shows the LD structure and the LD coefficients (D′) between five polymorphisms studied in PCOS and control subjects. In the D’ plot each diagonal represents a different gene polymorphisms with each square representing a pair wise comparison between two genes. Red squares indicate statistically significant linkage disequilibrium (LOD>2) between the pair of genes, as measured by the D′ statistic; darker colors of red indicate higher values of D′, upto a maximum of 1. The white squares and blue squares indicate no statistically significant evidence of LD with D′ values of <1 and 1 respectively. Linkage was higher between rs1799964 and rs361525 could be observed in both the controls and PCOS group pointing out the fact that both the variations are inherited as a single entity in an individual. No significant D’ values could be observed in any other combinations indicating the entities are being inherited as a single unit. The possibility of association between different haplotype combinations of the gene polymorphisms undertaken in the present study in PCOS was tested by performing haplotype analysis. Seventeen haplotypes were identified, among them three combinations of haplotypes showed significant results. The haplotype combination “A-A-C-A-C” and “A-G-T-G-C” conferred protection towards PCOS (OR= 0.321, CI= 0.15 – 0.67, p=0.002 and OR= 0.28, CI= 0.11 – 0.73, p=0.005 respectively) while the haplotype combination “A-G-C-A-C” conferred fourfold risk (OR= 3.38, CI= 1.52 – 7.53, p= 0.0018) towards PCOS susceptibility. The individual SNP involved in the haplotype combinations are: rs1137101 – rs1800629 – rs1799964 – rs361525 – rs1800795. The estimated Chi square values and relative risk estimates at p values ≤0.05 for the 17 haplotypes identified in the present study, are given in Table 7. Haplotypes with a frequency of p<0.01 were excluded from the analysis.
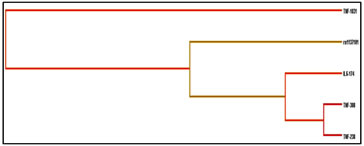
Multifactor Dimensionality Reduction (MDR) Analysis Sequence variants in human genes are being described in remarkable numbers. Determining which variants and which environmental factors are associated with common, complex diseases has become a daunting task. This is partly because the effect of any single genetic variation will likely be dependent on other genetic variations (gene-gene interaction or epistasis) and environmental factors (gene-environment interaction). Detecting and characterizing interactions among multiple factors is both a statistical and a computational challenge. To address this problem, multifactor dimensionality reduction (MDR) method for collapsing high dimensional genetic data into a single dimension has been developed, thus permitting interactions to be detected in relatively small sample sizes. In the present study, the MDR method using a software package for implementing MDR in a case-control design was used to study gene-gene interactions in PCOS. Table 8 represents the results obtained for the number of loci evaluated by MDR software (Version 2). The multi locus model with the best/maximum cross-validation consistency at p≤0.05 is considered to be the best model for disease manifestation and progression. The MDR analysis revealed the four locus model involving A668G, -308G/A, -1031T/C and -174G/C of IL-6 with a testing accuracy of 48% and CV consistency of 9/10 to be the best model in case of PCOS. Even though the table displays loci with a CV consistency of 10/10 for five locus, they were not considered since the testing accuracy was observed to be below the four locus model. As observed from the above entropy dendrogram, a synergistic interaction between -238G/A and -308G/A polymorphisms of the TNF-exists and both together express and appear to protect individuals from PCOS, while the leptin receptor polymorphism (rs1137101) exert its risk in an independent (redundant) manner conferring risk towards PCOS susceptibility (Figure 8)
Table 1: Genotypic and allelic frequency distribution of the TNF-α–238G/A polymorphism in controls and PCOS
HWE: Hardy Weinberg Equilibrium; χ2: Chi square
Table 2: Odds risk estimates of genotypes and alleles of PCOS compared to controls of the TNF-α -238G/A polymorphism
Table 3: Genotypic and allelic frequency distribution of the TNF-α 308G/A polymorphism in controls and PCOS
HWE: Hardy Weinberg Equilibrium; χ2: Chi square
Table 4: Odds risk estimates of genotypes and alleles of PCOS compared to controls of the TNF-α -308G/A polymorphism
Table 5: Genotypic and allelic frequency distribution of the TNF-α-1031T/C polymorphism in controls and PCOS
HWE : Hardy Weinberg Equilibrium; χ2: Chi square; p≤0.05
Table 6 : Odds risk estimates of genotypes and alleles of PCOS compared controls of the TNF-α -1031T/C polymorphism (p≤0.05)
Table 7: Haplotype Analysis
Table 8: Gene combinations leading to disease manifestation
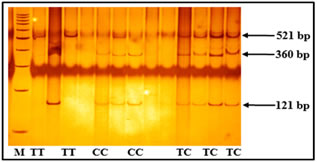
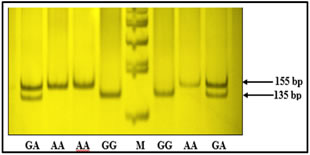
Figure 1: ARMS PCR showing genotypes of TNF-α -308G/A Figure 2: Genotypes of TNF-α -1031T/C polymorphism based on PCR-RFLP Polymorphism TT: 521 bp, TC: 521+360+121 bp, CC: 360+121 bp, Marker (M) = 100bp Figure 3: Depicting genotypes of TNF-α -238G/Apolymorphism GG: 135+20 bp, GA: 155+135+20 bp, AA: 155 bp, Marker (M) = 100bp
Figure 4 Figure 5 Figure 6 Figure 4: Secondary pre-mRNA structures of the TNF-α –238G/A polymorphism; Figure 5: Secondary pre-mRNA structures of the TNF-α -308G/A polymorphism; Figure 6: Secondary pre-mRNA structures of the TNF-α -1031T/C polymorphism Figure 7: Linkage disequilibrium plot of the variations in PCOS and controls in the present study (D’ values were indicated in the respective squares) Figure 8: Dendogram showing the interaction between various genes involved in the study DISCUSSION PCOS represents a common endocrine disorder seen in women of reproductive age and is often associated with inflammation6. The persistent chronic inflammation observed in PCOS could lead to ovarian dysfunction and other metabolic abnormalities7. TNF α is a proinflammatory cytokine present in follicular fluid of human ovary, granulosa cells and oocytes8, plays an important role in a wide range of diseases such as type 2 diabetes, coronary artery disease and dyslipidemia9. It elicits inflammatory responses as a normal physiological function for ovulation and influence follicular atresia, adiposity, insulin resistance, ovarian apoptosis, increased ovarian steroid secretion, anovulation and hyperandrogenism10. The present study was investigated to identify the association between three promoter polymorphisms (-238G/A, -308G/A and -1031T/C) and PCOS, a condition associated with inflammation. The genotypic and allele frequencies of -238G/A did not differ significantly between the patients and the controls indicating no role of this SNP in PCOS susceptibility. The minor allele ‘A’ of the −238G/A polymorphism and the rare allele ‘C’ of the −1031T/C polymorphism were reported to be associated with higher TNF- production11.The TNF-α -238G/A promoter polymorphism leads to addition of transcription factors T3R and Sp1 which play an important role in controlling cell growth and apoptosis The distribution of genotypes and did not vary between the groups; suggesting no association of -308G/A polymorphism with PCOS. Our results were in accordance with the studies in Australian, Caucasian and Indian population12. The rare ‘A’ allele of −308G/A polymorphism reportedly influences gene expression, resulting in higher TNF-α production in vitro13. The TNF-α -308G/A promoter polymorphism leads to deletion of binding sites of two transcription factors Sp1 and Usf (Upstream Stimulatory Factor) which may result in dysregulation of transcription and translation hence regulatory in nature. Our study also demonstrated no association of TNF-α -1031 T/C with PCOS and these findings suggested a strong influence on PCOS, similar to the findings of others in Asian population8,14 however contradictory to our study. The TNF-α -1031T/C promoter polymorphism leads to addition of GCN4 transcription factor containing leucine zipper or zinc finger motifs. It contributes to the ribonuclease activities controlling gene expression and RNA biogenesis in the nucleus, the major site of RNA turnover. A potential physiological role of TNF-α -308 G/A polymorphism has been identified in several studies15,16 and much recent reporter gene studies demonstrated a significant effect on its transcriptional activity (8, 17). Variation in TNF-α gene was reported to be linked with PCOS susceptibility in Korean population. Studies on TNF-α gene in PCOS patients from Australian, Caucasian and Indian population revealed lack of association of TNF-α -308 G/A polymorphism8,18,19. Li S et al. proposed that elevated TNF-α have been linked to obesity and insulin resistance in the Chinese population20. Literature suggest PCOS is a complex disorder that might result from the interaction of susceptible and protective gene variants under the influence of environmental factors 21 suggesting that the clinical phenotype of affected individuals is also influenced by gene-environment interaction.
CONCLUSION The present study could not provide a concrete association between the three TNF α polymorphisms and PCOS, further extensive studies on the influence of TNF-α polymorphism towards PCOS in different ethnic groups may identify the potentiality of these polymorphisms as markers of inflammation and in turn may help the clinicians for the better management of the condition. Functional studies on the reporter gene assays of this gene would be required further to gain meaningful insights on the aetiology of TNF-α towards PCOS phenotype.
REFERENCES
Policy for Articles with Open Access: Authors who publish with MedPulse International Journal of Pediatrics (Print ISSN: 2579-0897) (Online ISSN: 2636-4662) agree to the following terms: Authors retain copyright and grant the journal right of first publication with the work simultaneously licensed under a Creative Commons Attribution License that allows others to share the work with an acknowledgement of the work's authorship and initial publication in this journal. Authors are permitted and encouraged to post links to their work online (e.g., in institutional repositories or on their website) prior to and during the submission process, as it can lead to productive exchanges, as well as earlier and greater citation of published work.
|
|
||||||||||||||||||||||||||||||||||||||||||||||||||||||||||||||||||||||||||||||||||||||||||||||||||||||||||||||||||||||||||||||||||||||||||||||||||||||||||||||||||||||||||||||||||||||||||||||||||||||||||||||||||||||||||||||||||||||||||||||||||||||||||||||||||||||||||||||||||||||||||||||||||||||||||||||||||||||||||||||||||||||
 This work is licensed under a Creative Commons Attribution-NonCommercial 4.0 International License.