 Home
HomeOfficial Journals By StatPerson Publication
|
Table of Content - Volume 3 Issue 1 - July 2017
Correlation between thyroid profile and liver function tests in pregnancy
Madhu Sinha1*, Yogesh Krishna Sahay2
1Associate Professor, 2Assistant Professor, Department of Biochemistry, Anugrah Narayan Magadh Medical College, Gaya. Bihar, INDIA. Email: madhusinha03@gmail.com
Abstract Problem Statement: Liver has a key role in thyroid hormones metabolism and their serum level is very important for normal hepatic function and Bilirubin metabolism. Besides the associations between thyroid and liver disease of an autoimmune nature, such as primary biliary cirrhosis and thyrotoxicosis, thyroid diseases are frequently associated with liver injuries and biochemical test abnormalities. The pregnant woman experiences physiological changes to support fetal growth and development. During pregnancy, the serum estrogen and progesterone levels increase progressively and reach a maximum during the third trimester. Methods: It was Case and control study. the subjects were chosen from the OPD in the dept. of Gyne. and Obst. Anugrah Narayan Magadh Medical College, Gaya. The duration of study was from Jan 2015 to Oct 2016. 50 pregnant women were included in the study after following the exclusion and inclusion criteria. Normal healthy pregnant women between 21 – 35 years of age irrespective of the parity were included in our study. All the biochemical parameters were performed in the department of Biochemistry, Anugrah Narayan Magadh Medical College, Gaya. Results: In this study we observed a normal Fasting blood glucose level in both case and control group. Mean value of cases has been observed as 91.02 (SD±16.04) as compared to controls showing mean value 79.50 (SD±7.98). The result is statistically significant (p Value < 0.000). We found serum Bilirubin level in both case and control group mean value of cases has been observed as 0.98 (SD± 0.29) as compared to controls showing mean value 0.77(SD± 0.18). The result is statistically not significant (p Value < 0.142). TSH level in both case and control group mean value of cases has been observed as 4.61 (SD± 1.04) as compared to controls showing mean value 2.98(SD± 0.78). The result is statistically significant (p Value < 0.005). Conclusion: Thyroid dysfunction in pregnancy also claims attention for proper management; otherwise may complicates the lives of mother and baby. Key Words: Pregnancy, Hypothyroidism, Thyrotoxicosis, Biliary cirrhosis.
INTRODUCTION Physiologic changes associated with pregnancy require an increased availability of thyroid hormones by 40% to 100% to meet the needs of mother and fetus during pregnancy. Pregnancy has an effect on other thyroid functions with significant changes in iodine metabolism and clearance, serum thyroid binding proteins, and the development of maternal goitre, especially in areas with various levels of iodine deficiency. For the maternal thyroid gland to meet the demands of pregnancy, it must have sufficient supplies of iodine, be disease free, and capable of responding adequately. Thyroid autoimmunity is common and may contribute to miscarriage and hypothyroidism. The fetus is totally dependent on maternal thyroxine supply during the first trimester of gestation and up to mid gestation for normal neurologic development and nervous system maturation. Because the progression of pregnancy and fetal, neonatal and child health are dependent on adequate thyroid hormone supplementation throughout pregnancy, trimester-specific reference intervals for thyroid functions can be crucial for both maternal and fetal health. Trimester-specific data determined by immunoassay and by tandem mass spectrometry are now available. Thyroid dysfunction during pregnancy includes overt hypothyroidism (OH) and subclinical hypothyroidism (SCH), with a relative incidence of approximately 0.4% for OH and 3% for SCH, as well as overt and subclinical thyrotoxicosis, with relative incidences of approximately 0.2% for the former and 2.5% for the latter. Finally, concerning autoimmune thyroid disease (AITD), it was shown to range between 5 and 20%, with an average of 7.8%. AITD represents the main cause leading to hypothyroidism in pregnant women. Regarding hyperthyroidism, prevalence of Grave’s Disease (GD) with ranges between 0.1% and 1% and transient gestational hyperthyroidism syndrome, with ranges between 1 and 3%, have been reported.1 Multiple retrospective studies have shown that adverse outcomes of pregnancy, namely risks of maternal and fetal/neonatal complications, were directly related to the duration and inadequate control of maternal thyrotoxicosis.2-7 Poor control of thyrotoxicosis is associated with a risk of spontaneous abortion, congestive heart failure, thyrotoxic storm, preeclampsia, preterm delivery, low birth weight and stillbirth. In a study from Australia by Smith et al,8 the outcome of pregnancy was evaluated in women with undiagnosed GD. Results demonstrated severe prematurity (mean delivery time, 30 wks) associated with very low birth weight (<2 kg) and neonatal hyperthyroidism requiring antithyroid drugs (ATDs) treatment. In contrast, pregnancy outcome was excellent for women with GD in whom diagnosis was made early and ATD treatment was started promptly.8 TSH is a sensitive marker of thyroid dysfunction during pregnancy.9,10 This is true despite the significant effect of human chorionic gonadotropin (hCG) on TSH concentrations, especially in the first trimester. During the first trimester, hCG induces a decrease in circulating TSH and, as a consequence, reference values have been modified accordingly. As a result, utilizing normal values for the non-pregnant population leads to diagnostic errors. Due to the interference of pregnancy-modified plasma proteins, the measurement of maternal FT4 with the usual techniques presents some difficulties. Certain FT4 immunoassays have a high correlation with equilibrium dialysis, which is considered today as the gold standard for FT4 measurement during pregnancy.11,12 The pregnant woman experiences physiological changes to support fetal growth and development.[13] The levels of estrogens (estradiol) and progesterone increase progressively during pregnancy. These sex hormones have effects on hepatic metabolic, synthesis, and excretory functions.[14] The biliary excretion of bromosulfophthalein decreases during late pregnancy,15,16 and the clearance of some compounds that are secreted into bile may therefore be impaired.17 The phenomenon of hemodilution secondary to the increase in plasma volume decreases the serum protein concentrations. Consequently, certain changes in values of liver function tests occur during normal pregnancy. Hyperemesis gravidarum may be associated with liver involvement.[18] Nausea or vomiting occurring during the second or third trimester should be considered pathologic and should require investigations including the measurement of serum aminotransferase activity.19 It should be noted that jaundice and generalized pruritus should never be considered normal features in pregnancy. Vascular spiders and palmar erythema are commonly associated with chronic liver disease and pregnancy. In one published study conducted in United States of America, vascular spiders were found in 14% of white women by the second month of pregnancy and in 66% by the ninth month of pregnancy.20 The frequency of these vascular spiders was noted to be lower in black women with 8% occurring in the fourth month of pregnancy and 14% in the ninth month. MATERIAL AND METHODS Type of Study: Case and control study. Study Area: The subjects were chosen from the OPD in the dept. of Gynae. and Obst. Anugrah Narayan Magadh Medical College, Gaya. Study Duration: The duration of study was from Jan 2015 to Oct 2016. Study population and sampling frame: This research study design consists of Aims and Objectives and protocol were submitted for approval after getting the permission from the Ethical Committee, Anugrah Narayan Magadh Medical College, Gaya. Eligibility of the study population: 50 pregnant women were included in the study after following the exclusion and inclusion criteria. A short history and clinical examination of the patients were obtained regarding the period of gestation, height, weight, blood pressure, history of drug intake and after taking the verbal consent of the patient the blood samples were collected and the blood samples were tested in the department of Biochemistry, Anugrah Narayan Magadh Medical College, Gaya. Samples were collected for estimation of
Inclusion Criteria: Normal healthy pregnant women between 21 – 35 years of age irrespective of the parity were included in our study. Exclusion Criteria: Diabetes Mellitus, Hypertension, Tuberculosis patients were excluded in our study. Tools and Technique: Sample Collection: Blood samples were collected in two types of vial. Clotted Blood Sample: Where the vial had no anticoagulant. The clotted samples were used for performing serum LFT, GGT, FT3, FT4 and TSH Tests. Sodium Fluoride Vial: Here blood sample was collected for performing fasting blood glucose level (Contains anticoagulant). Tools: Main Instrument: All the biochemical parameters were performed in Semi automated analyzer mainly serum LFT, serum GGT, Fasting blood glucose and serum FT3, FT4, and TSH Test were performed in outside laboratory.
RESULTS
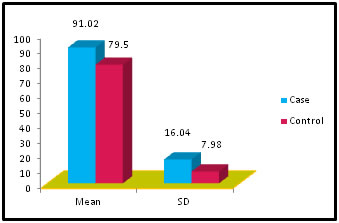
Table 1: Distribution of Glucose among case and control
Figure 1:
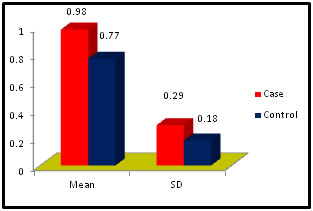
Table 2: Distribution of Bilirubin among case and control
Figure 2:
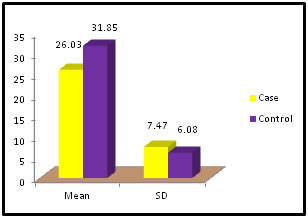
Table 3: Distribution of SGOT among case and control
Figure 3:
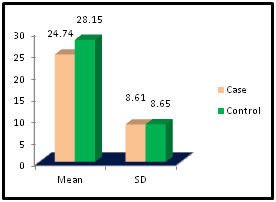
Table 4: Distribution of SGPT among case and control
Figure 4:
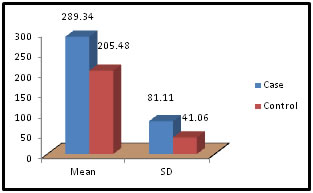
Table 5: Distribution of Alkaline Phosphatase among case and control
Figure 5:
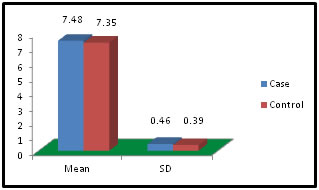
Table 6: Distribution of Total Protein among case and control
Figure 6:
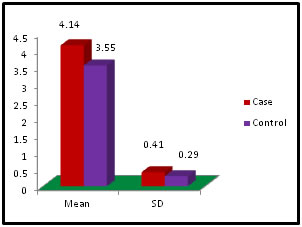
Table 7: Distribution of Albumin among case and control
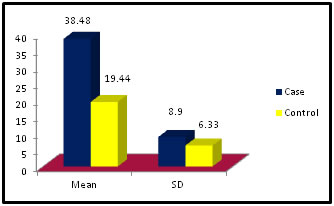
Figure 7: Table 8: Distribution of Gamma Glutamyl Transpeptidase among case and control
Figure 8:
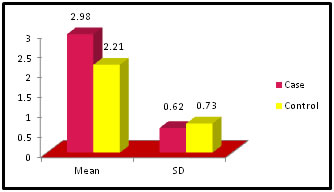
Table 9: Distribution of FreeT3 among case and control
Figure 9:
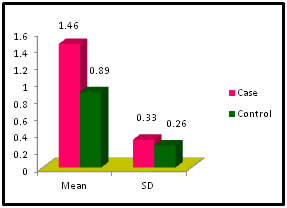
Table 10: Distribution of FreeT4 among case and control
Figure 10:
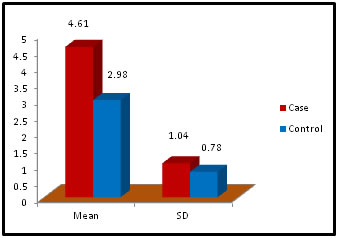
Table 11: Distribution of TSH( Thyroid Stimulating Hormone) among case and control
Figure 11: DISCUSSION The study was carried out in the Department of Biochemistry in collaboration with the department of Gynae. and Obs. at Anugrah Narayan Magadh Medical College, Gaya. In this study 50 pregnant women were selected as cases and 50 non-pregnant healthy women selected as control group in the age group of 21-35 years. The objective of the study was to establish a co-relation between thyroid profile and Liver function test in pregnancy. It is well known that thyroid disorder affect pregnancy and results in various complications to mother as well as to the fetus and to the newborn. Thyroid gland dysfunction should be taken with special interest during pregnancy period. Hepatic dysfunction during pregnancy is life threatening. So liver function test is one of the important tests in pregnancy. Proper interpretation of liver function test at an early stage of pregnancy can help in proper management and thus thereby preventing the complications to mother and the chances of fetal loss will be minimum. In this study we observed a normal Fasting blood glucose level in both case and control group. Mean value of cases has been observed as 91.02 (SD±16.04) as compared to controls showing mean value 79.50 (SD±7.98). The result is statistically significant (p Value < 0.000). We found serum Bilirubin level in both case and control group mean value of cases has been observed as 0.98 (SD± 0.29) as compared to controls showing mean value 0.77(SD± 0.18). The result is statistically not significant (p Value < 0.142). We found serum SGOT level in both case and control group mean value of cases has been observed as 26.03 (SD± 7.47) as compared to controls showing mean value 31.85(SD± 6.08). The result is statistically significant (p Value < 0.000). We found serum SGPT level in both case and control group mean value of cases has been observed as 24.74 (SD± 8.61) as compared to controls showing mean value 28.15(SD± 8.65). The result is statistically significant (p Value < 0.005). We found serum Alkaline Phosphatase level in both case and control group mean value of cases has been observed as 289.34 (SD± 81.11) as compared to controls showing mean value 205.48(SD± 41.06). The result is statistically significant (p Value < 0.001). We found serum Total Protein level in both case and control group mean value of cases has been observed as 7.48 (SD± 0.46) as compared to controls showing mean value 7.35(SD± 0.39). The result is statistically not significant (p Value < 0.080). We found serum Albumin level in both case and control group mean value of cases has been observed as 4.14 (SD± 0.41) as compared to controls showing mean value 3.55(SD± 0.29). The result is statistically significant (p Value < 0.000). We found serum GGT level in both case and control group mean value of cases has been observed as 38.48 (SD± 8.90) as compared to controls showing mean value 19.44(SD± 6.33). The result is statistically significant (p Value < 0.000). We found serum FT3 level in both case and control group mean value of cases has been observed as 2.98 (SD± 0.62) as compared to controls showing mean value 2.21(SD± 0.73). The result is statistically significant (p Value < 0.005). We found serum FT4 level in both case and control group mean value of cases has been observed as 1.46 (SD± 0.33) as compared to controls showing mean value 0.89(SD± 0.26). The result is statistically significant (p Value < 0.000). We found serum TSH level in both case and control group mean value of cases has been observed as 4.61 (SD± 1.04) as compared to controls showing mean value 2.98(SD± 0.78). The result is statistically significant (p Value < 0.005). In this above study I found no significant co-relation emerged between any thyroid hormones and any of the liver enzymes either in cases or controls. It is also observed in the study “Correlation between plasma thyroid hormones and liver enzymes level in thyrotoxic cases and controls in Hazara Division”. Tariq Mehmood Khan, Saquib Malik, Inayat Ullah Diju- J Ayub Med Coll Abbottabad 2010; 22 (2): - Although liver enzymes levels were slightly elevated in many thyrotoxic cases, no significant correlation emerged between any of the thyroid hormones and any of the liver enzymes, either in cases or controls.21
CONCLUSION We performed a case, control study during pregnancy in order to establish a co-relation between the liver function test and thyroid function. Our observation was all the 50 pregnant women showed normal liver function parameters and thyroid profile as compared to 50 non-pregnant healthy female as control. The study was carried out as in pregnancy hepatic dysfunction may threaten the life of mother and fetus and new born. Thyroid dysfunction in pregnancy also claims attention for proper management; otherwise may complicate the lives of mother and baby.
REFERENCES
|
 This work is licensed under a Creative Commons Attribution-NonCommercial 4.0 International License.