 Home
HomeOfficial Journals By StatPerson Publication
|
Table of Content - Volume 3 Issue 2 - August 2017
Urinary albumin creatinine ratio (ACR) – A comparative study on two different instruments
Luca Van Rooy1, Vasudha K C2*, Vanitha Gowda M N3, Radhika K4, Leen Puimege5
1Undergraduate Student, 5Faculty, Department of Medical Laboratory Technology, HoGhent, BELGIUM. 2,3Professor, Department of Biochemistry, Ramaiah Medical College, MSRIT Post, Bangalore-560054, Karnataka, INDIA. 4Lecturer cum Statistician, Department of Community Medicine, Ramaiah Medical College, MSRIT Post, Bangalore-560054, INDIA. Email: vasudhachokkanna@yahoo.co.in
Abstract Aim: The aim of this study was to correlate urinary ACR obtained on two different instruments-spectrophotometer and auto analyser. Study Design: A cross sectional study. Methodology: Urine samples from subjects aged between 18-70 years, that was received in the Biochemistry laboratory, M S Ramaiah Hospital, with a request for estimation of urinary microalbumin /urinary albumin Creatinine ratio was collected. Urinary ACR was estimated using an auto analyser, cobas 6000. 55 of these urine samples that had values for ACR in the normo albuminuric range or micro albuminic range were estimated for urinary ACR using colorimetric kits. All the quantitative variables were analysed and summarised using descriptive statistics. The intraclass correlation and Bland Altman plot was used to assess the agreement between the results obtained from the two instruments. Results: The intraclass correlation for ACR was 0.87 (87 %) with a confidence interval of 95 % having a highly significant P value of <0.001 for urinary ACR was 87%. Conclusion: Urinary ACR measurement using a colorimetric kit may be a cost effective method to screen for micro albuminuria. Key Words: Colorimetry, microalbuminuria, urinary ACR, urinary creatinine.
INTRODUCTION Normal individuals usually excrete very small amounts of protein in the urine. Persistently increased protein excretion is a marker of kidney damage. The excretion of specific types of protein, such as albumin or low molecular weight globulins, depends on the type of kidney disease that is present. Increased excretion of albumin is a sensitive marker for chronic kidney disease due to diabetes, glomerular disease, and hypertension. Measurement of protein excretion in a 24-hour collection has been the longstanding “gold standard” for the quantitative evaluation of proteinuria. An alternative method is measurement of the ratio of protein or albumin to creatinine in an untimed “spot” urine specimen. These ratios correct for variations in urinary concentration due to hydration and provide a more convenient method of assessing protein and albumin excretion than that involved with timed urine collections. The National Kidney Foundation recommends the use of urinary Albumin Creatinine Ratio (ACR) and estimated Glomerular Filtration Rate (eGFR) to detect renal dysfunction at an early stage1 It may not be possible to equip all the rural health centres in India with expensive auto analysers to screen for early renal injury. Therefore, this study was intended to compare the urinary ACR obtained from a colorimeter to that estimated on an autoanalyser, using the same methodology, in order to evolve a cost-effective periodic screening technique.
MATERIALS AND METHODS This work was carried out in the Department of Biochemistry, Ramaiah Medical college, Bangalore. Urine samples of patients in the age group pf 18-70 years that was received in the diagnostic laboratory, Ramaiah hospital, with a request for Urinary ACR estimation was processed on the auto analyser, Roche Cobas 6000. An ACR <30mg/gm of creatinine was considered normoalbuminuria and an ACR of 30-300mg/gm of creatinine was categorized as microalbuminuria.1 55 of these samples that had ACR ranging from normoalbuminuria to micro albuminuria were quantitatively estimated for creatinine and albumin using colorimetric kits (TURBILYTE®-MA colorimetric kit for albumin and Creatinine kit from Coral Clinical Systems for urinary creatinine) on a double beam spectrophotometer that worked on the same principle of immunoturbidimetry for urinary albumin and Jaffe’s reaction for Urinary creatinine as that on the auto analyser.2,3. ACR was calculated using the values obtained. The exclusion criteria for sample collection was pregnancy, acute renal failure, malnourishment, obesity, cancer, any critical illness and neuromuscular diseases.
RESULTS Values obtained for urinary albumin creatinine ratio (ACR) from both instruments were compared to see if the cut-off level for ACR that differentiates normoalbuminuria from microalbuminuria would be similar. The number of samples with ACR < 30 mg/g was 25, and these samples were categorized as group 1 (normoalbuminuria). Group 2 (microalbuminuria) had 30 samples with values for ACR ranging from 30 mg/g to 300 mg/g as seen in Table 1.
Table 1: ACR values obtained from the cobas 6000 categorized into 2 groups.
Table 2: Sensitivity and specificity for ACR values obtained on the spectrophotometer in comparison with those on the auto-analyzer
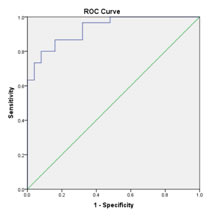
Table 2, shows a sensitivity of 83 % and a specificity of 84 % for an ACR value of 29.95 mg/g on the spectrophotometer. This means any value ≥ 29.95 mg/g on the spectrophotometer would be categorized as microalbuminuria, which is almost the same as the cut-off value of ≥ 30 mg/g on an auto analyser. Figure 1: ROC for Urinary ACR values from the spectrophotometer
Table 3: Values for area under the curve and the confidence interval
The area under the curve for ACR on the spectrophotometer in comparison with the auto-analyzer was 0.93, which indicates it is an excellent test. Table 4: Diagnostic accuracy of ROC curve analysis4
Table 5: Intra Class Correlation for Urinary ACR from both instruments
For Urinary ACR, the intra class correlation is strong with a value of 0.87 that has a highly significant P value of < 0.001.
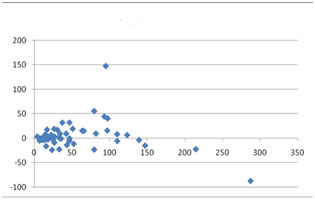
Figure 2: Bland-Altman Plot The y-axis represents the difference between the two methods and the x-axis represents the mean of the two methods. This curve supports the agreement of reliability for Urinary ACR obtained on both instruments
DISCUSSION Laboratory measurement of urine albumin/urine total protein has been used to diagnose and monitor renal kidney dysfunction in diabetics and hypertensives for the last three decades. In view of the fact that CKD confers cardio vascular risk, it demands a more sensitive and timely detection of albumin in the urine. Detection of early renal dysfunction is of major importance since therapeutic intervention, in this stage, will reverse the course of the disease towards normal. Urinary albumin can be estimated using various methods, such as immune-assays, ELISA and immunoturbidimetry. Among these, the conventional and most sensitive method is immunoturbidimetry. Ideally, the samples recommended for such measurements are timed collections over a period of 24 hours or an early morning freshly voided midstream sample. Collecting either of these samples from out-patients, is a practical disadvantage. Random spot urine samples could however be potentially influenced by exercise and diet, leading to false results. Other factors shown to interfere with urinary albumin levels are urinary tract infection, elevated blood pressure, hydration and poor control of blood glucose levels. Repeated periodical measurements on different samples will have to be done to allay the false results in such instances.5 This study used random spot urine samples for the urinary albumin estimation since these are easy to collect and the measurement only aims at screening for microalbuminuria. National Kidney Foundation now recommends measurement of ACR on spot urine samples to detect microalbuminuria. It defines an ACR between 30 to 300 mg/g as microalbuminuria. Urinary ACR is the preferred measurement in spot urine samples because it overcomes all the variables that may affect the measurement of urinary albumin. When the albumin concentration is divided by the creatinine concentration, the number of false negative subjects tend to decrease, which is highly desirable for diabetic and hypertensive renal dysfunction screening.6 In this study, the Urinary ACR measurement on the spectrophotometer showed a sensitivity of 83 % and a specificity of 84 % when compared to the measurement on the auto-analyzer (Table 2). The standard error of difference was only 0.31 with a highly significant P value of 0.000 and a confidence interval of 95 %, which means Urinary ACR measurements on the spectrophotometer differentiated true normoalbuminuria from true microalbuminuria to an extent of 95 % (Table 3). The area under the curve in the ROC curve (Figure 1) is 0.93, which indicates that the measurement of ACR using a spectrophotometer is also an excellent test and is comparable to that on the auto-analyzer. The Bland-Altman method calculates the mean difference between two methods of measurement (the bias), and 95 % limits of agreement as the mean difference (1.96 x SD). It is expected that the 95 % limits include 95 % of the differences between the two measurement methods. The plot is commonly called a Bland-Altman plot and the associated method is usually called the Bland-Altman method. The Bland-Altman method can even include estimation of confidence intervals for the bias and limits of agreement.7,8 This study was based on the presumption that the reliability of measurements for Urinary ACR on the two different instruments will have an agreement of 0.7 or 70 %. The intra class correlation for Urinary ACR was 0.87 (87 %) with a confidence interval of 95 % having a highly significant P value of <0.001 (Table 5) indicating that the measurement of Urinary ACR on the spectrophotometer is comparable to that on the auto-analyzer to an extent of 95 %. The Bland-Altman plot (Figure 2) has 95 % of the values lying within the 1.96 SD range. The reliability of agreement between the two measurements is thus 87 %. A few values of Urinary ACR that are scattered beyond the 1.96 SD range could be random errors owing to a faulty pipetting technique, voltage fluctuations or other variables. This could have been corrected by repeating the measurements on those samples which however was not possible in this study because of the limited availability of reagents.
CONCLUSION ACR measured on the spectrophotometer gave values comparable to that on an auto-analyzer to an extent of 95%. Moreover, measurement of ACR using a spectrophotometer, could use the same cut-off level of ≥30 mg/g creatinine to differentiate between normoalbuminuria and microalbuminuria. This study has shown that a cost effective instrument and method for screening for microalbuminuria can be established in rural health centers, thus giving those patients with diabetes or hypertension easy access to the monitoring of their renal function. Only those patients that are diagnosed as microalbuminurics need to be sent to the peripheral hospitals for intervention and treatment. Availability of such a facility at rural outreach centers would improve the quality of life in the above mentioned co-morbid conditions by providing an opportunity for early detection and treatment of renal dysfunction.
REFERENCES
|
||||||||||||||||||||||||||||||||||||||||||||||||||||||||||||||||||||||||||||||||||||||||||||||||||||||||||||||||||||||||||||||||||||||||||||||||||||||||||||||||||||||||||||||||||||||||||||||||||||||||||||||||||||||||
 This work is licensed under a Creative Commons Attribution-NonCommercial 4.0 International License.