 Home
HomeOfficial Journals By StatPerson Publication
|
Table of Content - Volume 3 Issue 2 - August 2017
Correlation of 24-hour urinary protein, urinary protein: Creatinine ratio and HBA1c in type 2 diabetes with and without nephropathy
S Mohammed1, S Anees2*, F Nazki3
1,3Resident PG, 2Professor and HOD, Department of Biochemistry, Department of Biochemistry, Owaisi Hospital and Research Centre, Kanchanbagh, DMRL X Roads, Santoshnagar, Hyderabad-500008, INDIA. Email: syyedaanees69@gmail.com
Abstract Background: The leading cause of morbidity and premature mortality in diabetics is nephropathy. Glycemic control is closely associated with renal involvement in diabetes. Proteinuria is an important clinical sign in Diabetic Nephropathy. Objectives: To estimate serum levels of HbA1c, 24- hour urinary protein concentration and urinary protein: creatinine ratio in Type 2 diabetics with and without nephropathy. To assess correlation between protein: creatinine ratio, 24-hour urinary protein and HbA1c levels in these groups. Materials and Methods: Cross sectional study was conducted in the department of Biochemistry, Owaisi Hospital, from October 2016 to May 2017 on 103 diabetes patients comprising of 41 diabetics without nephropathy (Group A) and 62 Type 2 diabetes subjects with nephropathy (Group B). The following parameters were estimated: Fasting blood glucose, Serum creatinine, HbA1c, Urinary protein and creatinine. Results: Results show that the mean values of fasting blood glucose, serum creatinine, HbA1c, 24-hour urinary protein and protein to creatinine ratio are significantly increased in Group B when compared to Group A and these parameters are further increased in diabetic subjects with P: C ratio ≥ 0.2 than those with <0.2 Result: 24-hour urinary protein and protein: creatinine ratio levels are significantly increased (p< 0.001) with proteinuria more than the physiological range (P: C ratio 0.2) than within physiologicalrange (P: C < 0.2).24- hour urinary protein and P:C ratio also correlated positively with high significance.HbA1c levels correlated positively with both P:C ratio and 24-hour urinary protein levels. Conclusion: This study suggests estimating HbA1c as an indicator of glycemic control .P:C ratio is convenient method for early diagnosis and intervention for diabetic nephropathy. Key Words: Type 2 Diabetes; HbA1c; protein: creatinine ratio; 24- hour urinary protein.
INTRODUCTION Diabetes mellitus is the major health problem affecting people all over the world and has significantly increased world-wide and projected to increase in future. Prolonged period of hyperglycemia leads to various acute and chronic complications which affect eyes, kidneys, nerves and blood vessels. The various complications are due to long standing metabolic derangement which is associated with irreversible functional and structural changes in cells of the body. Long term glycemic control is assessed by measuring theHbA1c level in people with diabetes mellitus¹. Nephropathy in diabetes is a leading cause of morbidity and mortality. It is the commonest cause of end stage renal disease². Occurrence of nephropathy is around 40% in type 1 and 25% in type 2 diabetes mellitus³. Degree of proteinuria is the useful marker for renal involvement and response to treatment4. It is the commonest manifestation for diabetic involvement of glomerulus. Patients with poor glycemic control exhibit proteinuria. An association between hyperglycemia and renal disease involving persistent proteinuria has been demonstrated. Patients with poorly controlled diabetes has more rapidly progressive nephropathy than those with well controlled diabetes5. Quantitative measurement of protein in a 24-hour urine collection remains the gold standard, since protein excretion may vary with the circadian rhythm6. But it has major limitations like time consumption and error in sample collection. An alternative method for quantitative evaluation of proteinuria is the measurement of protein to creatinine ratio in an untimed urine sample. The protein creatinine ratio takes into account the fact that creatinine excretion remains fairly constant in presence of a stable GFR. The protein excretion would also be fairly stable. Therefore, the ratio of the two in a single voided sample would reflect the cumulative protein excretion over the day, as the two stable rates would cancel out the time factor7. The protein: creatinine ratio in random urine sample was found to correlate with 24-hour urinary protein concentration and this method could be considered as useful for screening purposes and as an outpatient procedure. In this study, we tried to determine the correlation of random urine protein: creatinine ratio (P:CRatio) with 24-hour urine protein estimation and to study the association of biochemical parameters like serum creatinine,HbA1c with urine P:CRatio in Type 2 diabetes mellitus patients with and without nephropathy.
MATERIALS AND METHODS Cross sectional study was conducted in the department of Biochemistry, Owaisi Hospital, from October 2016 to May 2017 on 103 patients comprising 41 Type 2 diabetics without nephropathy (Group A) and 62 Type 2 diabetes subjects with nephropathy (Group B).The selected subjects included both males and females in the age group of 20 years to 82 years. Informed consent was taken and approval from ethics committee was also obtained. Detailed medical history and relevant clinical examinations were carried out in these patients. Patients with chronic renal failure, glomerular nephritis due to other systemic conditions and hypertensives were excluded from the study. Under aseptic conditions, fasting blood samples were collected from antecubital vein for the estimation of fasting blood glucose (hexokinase method), serum creatinine (Jaffe’s method), HbA1c (immunoturbidimetry method) and urine samples for estimation of 24- hour urinary protein (sulfosalicylic acid method, protein creatinine ratio (collected on the day of deposition of 24 hr sample) in a random urine sample. The blood samples were analyzed on Cobas c311 fully automated analyzer and urinary parameters on Chem 7 semi auto-analyzer. All the analytes estimated are subjected to standard quality control (QC) guidelines. External Assurance Quality scheme (EQAS) is under CMC Vellore. Internal Quality control is run twice daily with both first party controls (Cobas-PCC1, PCC2 and third party controls (Randox). Statistical Analysis Mean, standard deviation and range values were used to describe the data. Student’s ‘t’ test was used for comparison between two groups. Relationship between variables were assessed by Pearson’s correlation coefficient. Categorical data was analyzed by chi-square test. p-value of 0.05 or less was considered as statistically significant.
RESULTS In the present study, we considered 103 diabetic subjects, including 62 subjects with nephropathy and 41 subjects without nephropathy. Of the 62 diabetic nephropathy subjects, 31 are male and 31 female subjects and among Group A 24 are males and 17 females. We studied HbA1c which is a marker for glycemic control and protein: creatinine ratio correlating with 24-hour urinary protein excretion.
Table 1: Comparison of fasting blood glucose, serum creatinine, HbA1c, 24-hour urinary protein and protein: creatinine levels in Group A and Group B
It is evident from the table that levels of fasting blood glucose, serumcreatinine, HbA1c, 24-hour urinary protein and protein: creatinine ratio is increased in diabetic subjects with nephropathy as compared tosubjects without nephropathy. The increase is highly significant for fasting blood glucose, HbA1c, 24-hour urinary protein and protein: creatinine ratio values (p < 0.001)
Table 2: Comparison of fasting blood glucose, serum creatinine, HbA1c, 24-hour urinary protein and protein: creatinine levels in (Group B) with P: C ratio 0.2 as cut-off value
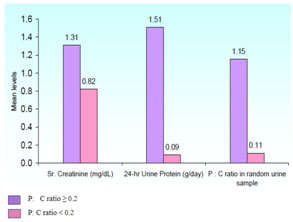
It is evident from the table that concentrations of fasting blood glucose, serum creatinine, HbA1c, 24-hour urinary protein and protein: creatinine ratio in diabetic subjects with protein: creatinine ratio of ≥0.2 are increased when compared to those diabetic subjects with protein: creatinine ratio < 0.2.
Figure 1: Showing serum creatinine, 24-hour urinary protein and p:c ratio with p:c ratio 0.2 as cut off value
Table 3: Shows the number ofdiabetic subjects having correlation between protein: creatinine ratio and 24-hour urinary protein
X² = 92.0, p < 0.001 HS (highly significant)
It is evident from the table that out of the 62 diabetic nephropathy subjects, 16 subjects with protein: creatinine ratio < 0.2, have 24-hour urinary protein concentration of < 0.2 gm/day. 37 subjects with protein: creatinine ratio 0.2-3.0, have 24-hour urinary protein concentration of 0.2 – 3.0 gm/day. 4 subjects with protein: creatinine ratio > 3.0, have 24-hour urinary protein concentration of > 3.0 gm / day. Of remaining 5 diabetic subjects, 2 subjects have protein: creatinine ratio < 0.2 and 24-hour urinary protein concentration 0.2 – 3.0 gm/day. Other 2 subjects have protein: creatinine ratio 0.2– 3.0 and 24- hour urinary protein concentration < 0.2 gm/day. Another 1 subject has protein: creatinine ratio 0.2 – 3.0 and 24-hour urinary protein concentration > 3.0 gm/day. It is evident from the table that correspondence of protein: creatinine ratio and 24-hour urinary protein concentration in diabetic nephropathy subjects is highly significant (p < 0.001).
Table 4: Validity of HbA1c levels of glycemic control with cut-off level of 6.9%
It is evident from the table that HbA1c has sensitivity of 73%, specificity of 93%, positive predictive value of 94%, negative predictive value of 69% and accuracy of 81% for predicting level of glycemic control.
Table 5: Validity of protein: creatinine ratio and 24-hour urinary protein for nephropathy with cut-off value of 0.20
It is found from the table that sensitivity, specificity, positive predictive value, negative predictive value and accuracy of 24-hour urinary protein concentration and protein: creatinine ratio are almost same for nephropathy.
Table 6: Pearson’s correlation co-efficient (r)
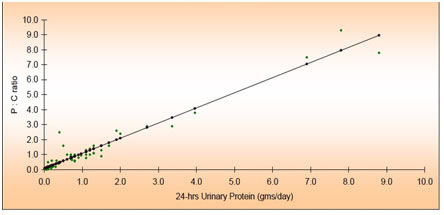
It is evident from the table that correlation between Serum creatinine and 24-hour urinary protein concentrations, Serum creatinine and protein: creatinine ratio values, 24-hours urinary protein and protein: creatinine ratio are highly significant(p < 0.001). It is evident from the table that there is positive correlation between Fasting blood glucose and HbA1c. HbA1c and 24-hour urinary protein, HbA1c and protein: creatinine ratio but are not statistically significant. Figure 2: Shows correlation between 24-hour urinary protein and p:c ratio
DISCUSSION Diabetes mellitus is the commonest endocrine disorder leading to various acute and chronic complications with associated morbidity and premature mortality. Diabetic Nephropathy is one of such complication. Screening and early diagnosis for involvement of kidneys is to be considered. In the present study, mean values of fasting blood glucose, serum creatinine, HbA1c, 24-hour urinary protein and protein to creatinine ratio are significantly increased in Group B when compared to Group A. It is also observed that HbA1c level has positive correlation with 24-hour urinary protein concentration and protein: creatinine ratio levels. HbA1c, 24-hour urinary protein concentration and protein: creatinine ratio levels are significantly increased in diabetic subjects with protein excretion more than the physiological range (P: C ratio ≥ 0.2) when compared to those within physiological range (P: C < 0.2). The present study showed a positive correlation between the random urine P:C ratio and 24-hour urinary protein in type 2 diabetes mellitus patients. The long-term complications of diabetes appear to develop as a result of aninterplay between abnormal metabolic milieu of diabetes and hemodynamic factors10.The metabolic disturbance of diabetes initiates nephropathy, through a disturbance of glomerular hemodynamic factors and then by impaired charge selectivity. The glomerular lesion is due to thickening of glomerular basement membrane and expansion of mesangium8.Each of these leads to increased glomerular filtration of proteins mainly albumin9. Measurement of protein excretion in a 24-hour urine collection is the gold standard for the quantitative evaluation of proteinuria. However, this method is inconvenient, since it is difficult to collect (more so in women) a complete 24-hour urine sample accurately especially in outpatient setting. The spot morning urine P:C ratio is independent of errors and it is also very minimally affected by wide variations in urinary protein excretion rate which is associated with changes in posture, physical activity and hemodynamic factors11 nephropathy. Pearson’s correlation coefficient was +0.97 which showed significant association between P:C ratio and 24-hour urinary protein.
CONCLUSION A relationship exists between glycaemic status and nephropathy in diabetes. The present study suggests estimating HbA1c as an indicator of glycaemic control. Since urinary protein to creatinine ratio correlates well with the 24-hour urinary protein concentration which is in accordance with many previous studies in the screening and evaluation of diabetic nephropathy12,13,14,15. Hence P: C ratio serves as an early, accurate, convenient, inexpensive and reliable tool to estimate proteinuria.
REFERENCES
|
||||||||||||||||||||||||||||||||||||||||||||||||||||||||||||||||||||||||||||||||||||||||||||||||||||||||||||||||||||||||||||||||||||||||||||||||||||||||||||||||||
 This work is licensed under a Creative Commons Attribution-NonCommercial 4.0 International License.