Official Journals By StatPerson Publication
|
Table of Content - Volume 4 Issue 3 - December 2017
Relationship between glycosylated haemoglobin and risk of microalbuminuria in patient with type II diabetes mellitus
Yogesh Krishna Sahay1*, Madhu Sinha2
1Assistant. Professor, 2Associate Professor, Department of Biochemistry. Anugrah Narayan Magadh Medical College, Gaya. Bihar, INDIA. Email: dryogeshkrsahay@gmail.com
Abstract Problem Statement: Nephropathy is one of the complications of type 2 diabetes mellitus that could lead to end‑stage renal disease. Persistent microalbuminuria is the best predictor of high risk of developing diabetic nephropathy. The relation between HbA1c and microalbuminuria with the duration of diabetes is not clear. Methods: It was prospective Study, The subjects were chosen from the Out Patient Department and Indoor Patient Department of Medicine, Anugrah Narayan Magadh Medical College, Gaya. Bihar. The duration of study was from December 2016 to August 2017. The study group consists hundred cases of 20-60 years age group from rural and urban area after following the exclusion and inclusion criteria. We divided hundred patients in four age groups i.e. 20-30 years, 31-40 years, 41-50 years and 51-60 years of age group. A short history and clinical examination of the patients were obtained regarding the blood pressure, history of smoking, alcohol intake and after taking the verbal consent of the patient after that blood and Urine samples were collected. Blood and Urine samples were tested in the Department of Biochemistry, Result: In the present study we divided total 100 patients in four age groups out of them 58 were male and 42 we female. Maximum number of patients belongs to 51-60 years of age group. Among them 34%17 were male and 26%13 were female. The present study comprises total 100 patients among them 24 (48%) were male and 26 (52%) were female who belong to urban area and 34 (68%) were male and 16 (32%) were female who belong to rural area respectively. we found that in urban area 42%21 male patients and 3%6 female patients were smokers. Likely in rural area 64% (32) male patients and 4% (2) female patients were smokers. Rest of the patients of our study were non smokers. The correlation between HbA1c and Micro Albumin of our study. The mean and ±SD was 7.5200 ±1.53 and 36.1330 ±53.79 for HbA1c and Micro albumin respectively. And we found the correlation statistically significant. Conclusion: Present study showed a positive correlation of microalbuminuria with duration of diabetes and level of glycaemic control (measured by HbA1c levels), which is in accordance with many previous reports. Also, presence of concomitant hypertension and smoking were important risk factors in early development of nephropathy. Therefore, regular screening for microalbuminuria in addition to continuous HbA1c estimation are important tools in the management of DM. Key Words: Nephropathy, Microalbuminuria, Type 2 diabetes mellitus
Diabetes mellitus (DM) is one of the most common chronic diseases in most countries.1 Diabetic nephropathy (DN) is one of the most common complications, and an important cause of renal failure.2 Microalbuminuria is the earliest clinically detectable stage of diabetic kidney disease at which appropriate interventions can retard, or even reverse, the progress of nephropathy.3 Glycosylated haemoglobin (GHb) is a useful index of mean glycaemia during the preceding 120 days.4 It is also a predictor of complications as measures reducing HbA1c correspondingly reduce the risk of complications.5 The present study was done to evaluate the relationship between duration of diabetes, degree of hyperglycemia and the incidence of microalbuminuria in patients with diabetes mellitus. This correlation can have important implications in deciding how strictly the blood sugar levels of diabetic patients need to be controlled for optimum health and prevention of complications like diabetic nephropathy. The first detectable sign of kidney damage is the appearance of microalbuminuria.6 This allows early intervention with the goal of delaying the onset of overt diabetic nephropathy.7 To maximize prevention of microalbuminuria development, blood pressure should be maintained at less than 130/80 mm Hg, and HbA1c should be kept below 7%.5 The level of glycaemic control also plays an important role in the transition from normoalbuminuria to microalbuminuria to macroalbuminuria.8 Hence, two important recommendations for the follow-up of diabetics include monitoring of glycaemic status by HbA1c and screening for nephropathy with urine microalbumin to assess disease progression and to detect potential progression towards end organ damage.9 Diabetes itself is not a high mortality condition, but is a major risk factor in other causes of death and has a high attributable burden of disability.10 Diabetic nephropathy, a common sequelae of uncontrolled diabetes, greatly affects the quality of life and contributes to decreased life expectancy.11 Good glycaemic control is the key to preventing the onset of diabetic nephropathy. Duration of diabetes and level of glycaemic control has a significant contribution for the development of microalbuminuria by prolonged exposure to hyperglycaemia induced advanced glycosylation end products accumulation. The fact that presence of microalbumin can lead to adverse outcomes in diabetics, and the recognition that its risk factors and clinical course are amenable to treatment provide a genuine case for action. Relation of microalbuminuria to glycosylated hemoglobin: Nephropathy is one of the complications of type 2 diabetes mellitus that could lead to end‑stage renal disease. Persistent microalbuminuria is the best predictor of high risk of developing diabetic nephropathy. The relation between HbA1c and microalbuminuria with the duration of diabetes is not clear. Diabetes mellitus is the leading cause of end‑stage renal disease (ESRD) in several countries.12 It is also the cause of chronic hemodialysis and renal transplantation. Several studies have suggested that detection of early changes in renal function via microalbuminuria tests prevent further progression of the disease.13‑16 Microalbuminuria is common (prevalence rates of 10-48%) and is a well‑established risk factor for macrovascular diseases in type 2 diabetics. Microalbuminuria defined as urinary albumin excretion rate of 20-200 μg/min or urinary protein excretion rate of 30-300 μg/min predicts future development of overt nephropathy.17 As microalbuminuria can be reversed and the future development of overt diabetic nephropathy significantly reduced, screening for microalbuminuria and timely therapeutic intervention has become standard of care worldwide. Microalbuminuria is also considered to be a predictor for cardiovascular disease both among diabetic and non‑diabetic subjects,18,19 and is one of the components of the metabolic syndrome (insulin resistance syndrome).15,20 Microalbuminuria (MAU) represents the simplest and most sensitive prognostic factor to evaluate the risk of overt nephropathy in diabetes, representing the first stage of progressive diabetic renal disease.21 However, it is not clear whether MAU represents an independent predictor or rather a marker of organ damage, since mechanisms linking MAU with end‑organ damage have not been fully explained.22 HbA1c is a blood glucose control marker in diabetic patients. Glycosylated hemoglobin (HbA1c) results from post‑translation changes in the hemoglobin molecule, and their levels correlate well with glycemic levels over the previous six to ten weeks. Glycosylation of hemoglobin takes place under physiological condition by a reaction between glucose and N‑terminal valine of beta chain of molecules.23 Higher levels of HbA1C were associated with increased risk for development of microangiopathy in diabetic. This may be due to the fact that HbA1c has special affinity for oxygen thereby causing tissue anoxia and plays a role in causation of micro and macroangiopathy.24 Several studies have shown a positive correlation between microalbuminuria and HbA1c.25‑28 However, this has not been established. These findings become an important and an interesting aspect for a detailed study. MATERIAL AND METHODS Type of Study: Prospective Study Study Area and Study Population: The subjects were chosen from the Out Patient Department and Indoor Patient Department of Medicine, Anugrah Narayan Magadh Medical College, Gaya. Bihar. Study Duration: The duration of study was from December 2016 to August 2017. Eligibility of the study population: The study group consists hundred cases of 20-60 years age group from rural and urban area after following the exclusion and inclusion criteria. We divided hundred patients in four age groups i.e. 20-30 years, 31-40 years, 41-50 years and 51-60 years of age group. A short history and clinical examination of the patients were obtained regarding the blood pressure, history of smoking, alcohol intake and after taking the verbal consent of the patient after that blood and Urine samples were collected. Blood and Urine samples were tested in the Department of Biochemistry, Anugrah Narayan Magadh Medical College, Gaya. Bihar. Samples were collected for estimation of
The tests were done in Semi auto analyzer. Strict external quality control using sera with known values are performed to validate the results. Inclusion Criteria
Exclusion Criteria The patients suffering from anemia, any other diseases or person using drugs that could affect HbA1c levels and microalbuminuria were excluded from the study.
RESULTS
Table 1: Age and Sex Wise Distribution
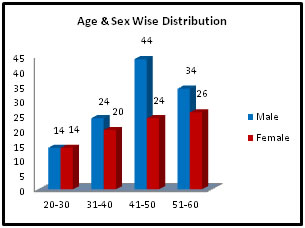
Figure 1: Age and Sex Wise Distribution
Table No: 1 shows age and sex wise distribution of the present study. In the present study we divided total 100 patients in four age groups out of them 58 were male and 42 we female. Maximum number of patients belongs to 51-60 years of age group. Among them 34% (17) were male and 26% (13) were female. Table 2: Socio-demographic Status
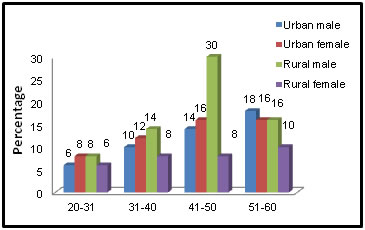
Figure 2: Socio-demographic Status
Table No: 2 Shows the distribution of the demographic status of our study. The present study comprises total 100 patients among them 24 (48%) were male and 26 (52%) were female who belong to urban area and 34 (68%) were male and 16 (32%) were female who belong to rural area respectively. The age and socio-demographic distribution is mentioned in the above table.
Table 3: Smoking Status
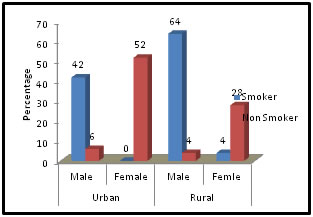
Figure 3: Smoking Status
In Table No:3 we found the smoking status of the patients. From the above table we found that in urban area 42% (21) male patients and 3% (6) female patients were smokers. Likely in rural area 64% (32) male patients and 4% (2) female patients were smokers. Rest of the patients of our study were non smokers.
Table 4: Range of Systolic and Diastolic Blood Pressure
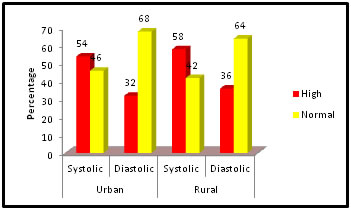
Figure 4: Range of Systolic and Diastolic Blood Pressure Table No:4 shows the high and normal status of systolic and diastolic blood pressure of the patients in urban and rural area. From Table No: 4 we found that in urban area 54% (27) patients and in rural area 58% (29) patients have high range of systolic blood pressure. Likely in case of high diastolic blood pressure range rural and urban area have 36% (18) and 32% (16) patients respectively. Rest of the patients have normal blood pressure level.
Table 5: Urea and Creatinine level
Figure 5: Urea and Creatinine level
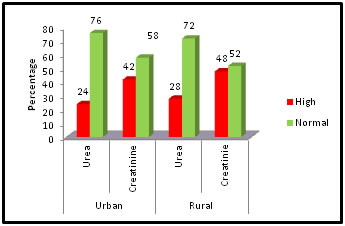
Table No:5 shows the high and normal status of urea and creatininelevel of the patients in urban and rural area. From Table No: 5 we found that in urban area 24% (12) patients and in rural area 28% (14) patients have high level of urea. Likely in case of creatinine level rural and urban area have 36% (18) and 32% (16) patients respectively. Table 6: Distribution of Biochemical Investigations
Figure 6: Distribution of Biochemical Investigations
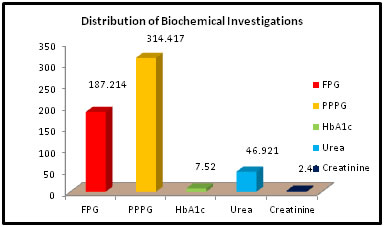
Table No: 6 shows the mean and ±SD value of the biochemical parameters we used for our study. The mean and ± SD value of Fasting Plasma Glucose, PP Plasma Glucose, HbA1c, Urea and Creatinine are: 187.214 ± 34.87, 314.417 ±52.64, 7.52± 1.68, 46.921 ± 10.48 and 2.41 ± 0.98 respectively. All the parameters are statistically significant except the urea level.
Table 7: Presence of Microalbuminuria in Diabetic patients
Figure 7: Presence of Microalbuminuria in Diabetic patients
From table No: 7 we found the number of patients who had high micro albumin level in our study. In urban area oriented patients we found 32% (16) male and (16%) 8 female who had high micro albumin level. And in rural area oriented patients the percentage is 48% (24) and 18% (9) for male and female patients respectively who had high micro albumin level. Table 8: Correlation between HbA1c and Micro Albumin
Figure 8: Correlation between HbA1c and Micro Albumin
Table No: 8 shows the correlation between HbA1c and Micro Albumin of our study. The mean and ±SD was 7.5200 ±1.53 and 36.1330 ±53.79 for HbA1c and Micro albumin respectively. And we found the correlation statistically significant.
DISCUSSION Table No: 1 shows age and sex wise distribution of the present study. In the present study we divided total 100 patients in four age groups out of them 58 were male and 42 we female. Maximum number of patients belongs to 51-60 years of age group. Among them 34% (17) were male and 26% (13) were female. The age range of patients in our study was 30- 80 years with the mean age of 52.2 years. Similar mean age was observed in various other studies by Chowta NK et al, Kanakmani J et al, Maskari FA et al.25 Although the exact reason why the residents of developing countries, especially Asian, are more prone to diabetes at a younger age remains speculative, there is growing evidence to support the concept of the ‘Asian Indian Phenotype’. The term refers to the peculiar metabolic features of Asians characterized by a propensity to excess visceral adiposity, elevated serum triglycerides and an increased ethnic susceptibility to diabetes.26 Table No: 2 Shows the distribution of the demographic status of our study. The present study comprises total 100 patients among them 24 (48%) were male and 26 (52%) were female who belong to urban area and 34 (68%) were male and 16 (32%) were female who belong to rural area respectively. The age and socio-demographic distribution is mentioned in the above table. Diabetic nephropathy is one of the most serious long-term complications of diabetes mellitus. Various epidemiological studies and cross-sectional studies have reported many variations in prevalence of microalbuminuria. Vijay et al. reported a prevalence of 15.7% in 600 type 2 diabetic patients in Chennai.115 Huraib et al reported a prevalence of 16.8% among 125 type 2 diabetic patients in Saudi Arabia.27 Varghese et al. reported a prevalence of 36.3% in 1425 type 2 diabetic patients in Chennai.28 The variation in the prevalence of microalbuminuria can be attributed to several factors such as difference in population, the definition of microalbuminuria, the methods of measurement of microalbuminuria and urine collection etc. Huraib et al. also used immunoturbidity method for the assessment of microalbuminuria[27] which is the same method followed in the present study. In Table No: 3 we found the smoking status of the patients. From the above table we found that in urban area 42% (21) male patients and 3% (6) female patients were smokers. Likely in rural area 64% (32) male patients and 4% (2) female patients were smokers. Rest of the patients of our study were non smokers. Microalbuminuria is a useful predictor of renal failure in diabetics. The causal risk factors for microalbumin are poor glycaemic control and raised blood pressure. Duration of diabetes, male sex and smoking as additional risk factors for microalbuminuria.29 Table No: 4 shows the high and normal status of systolic and diastolic blood pressure of the patients in urban and rural area. From Table No: 4 we found that in urban area 54% (27) patients and in rural area 58% (29) patients have high range of systolic blood pressure. Likely in case of high diastolic blood pressure range rural and urban area have 36% (18) and 32% (16) patients respectively. Rest of the patients have normal blood pressure level. The first detectable sign of kidney damage is the appearance of microalbuminuria.30 This allows early intervention with the goal of delaying the onset of overt diabetic nephropathy.118 To maximize prevention of microalbuminuria development, blood pressure should be maintained at less than 130/80 mm Hg, and HbA1c should be kept below 7%.31 The level of glycaemic control also plays an important role in the transition from normoalbuminuria to microalbuminuria to macroalbuminuria.25 Table No:5 shows the high and normal status of urea and creatininelevel of the patients in urban and rural area. From Table No: 5 we found that in urban area 24% (12) patients and in rural area 28% (14) patients have high level of urea. Likely in case of creatinine level rural and urban area have 36% (18) and 32% (16) patients respectively. Table No: 6 shows the mean and ±SD value of the biochemical parameters we used for our study. The mean and ± SD value of Fasting Plasma Glucose, PP Plasma Glucose, HbA1c, Urea and Creatinine are: 187.214 ± 34.87, 314.417 ±52.64, 7.52± 1.68, 46.921 ± 10.48 and 2.41 ±0.98 respectively. All the parameters are statistically significant except the urea level. From table No: 7 we found the number of patients who had high micro albumin level in our study. In urban area oriented patients we found 32% (16) male and (16%) 8 female who had high micro albumin level. And in rural area oriented patients the percentage is 48% (24) and 18% (9) for male and female patients respectively who had high micro albumin level. Table No: 8 shows the correlation between HbA1c and Micro Albumin of our study. The mean and ±SD was 7.5200 ±1.53 and 36.1330 ±53.79 for HbA1c and Micro albumin respectively. And we found the correlation statistically significant. Similar results were obtained in many other studies by Jha P et al, Al Sheikh et al, Muraliswaran P et al etc.29 High microalbumin levels can be due to irregular treatment and poor glycaemic control. The level of glycaemic control is a strong factor influencing the transition from normoalbuminuria to microalbuminuria.25 A lower percentage of microalbumin was also seen in a number of studies by Chowta NK et al, Kanakmani J et al, Verghese A et al25 while few studies by Maskari FA et al and Choo Kang E et al32 showed a higher percentage of microalbuminuria. This variation can be due to difference in ethnic susceptibility to nephropathy.33 This is in accordance to other studies by Al Sheikh et al, Maiti A et al, Afkhami M et al.29 This can be explained by the fact that higher HbA1c indicates persistent hyperglycaemia which leads to excessive protein glycosylation and subsequent deposition of these advanced glycated end products in the glomerulus. This results in glomerular hypertrophy and thickening of glomerular basement membrane, eventually leading to leakage of protein.[33] In contrast,in the study by Chowta N K et al25 maximum number of microalbumin positive patients had duration of diabetes more than 15 years. This can again be due to variation in glycaemic controls of the cases studied. The causal risk factors for microalbumin are poor glycaemic control and raised blood pressure.34 Studies show that once microalbuminuria is present, it is most likely to progress to protienuria in approximately 20- 50% of the subjects and is accelerated by the presence of hypertension. Smoking has been described to be a major risk factor for the development of microalbuminuria. In our study, of the total microalbumin positive patients, 57(65.5%) were also hypertensive and 52 (59.7%) were smokers. This is in agreement with many earlier studies.28,29 Diabetes itself is not a high mortality condition, but is a major risk factor in other causes of death and has a high attributable burden of disability.127 Diabetic nephropathy, a common sequelae of uncontrolled diabetes, greatly affects the quality of life and contributes to decreased life expectancy.35 Good glycaemic control is the key to preventing the onset of diabetic nephropathy. Duration of diabetes and level of glycaemic control has a significant contribution for the development of microalbuminuria by prolonged exposure to hyperglycaemia induced advanced glycosylation end products accumulation. The fact that presence of microalbumin can lead to adverse outcomes in diabetics, and the recognition that its risk factors and clinical course are amenable to treatment provide a genuine case for action.
CONCLUSION Present study showed a positive correlation of microalbuminuria with duration of diabetes and level of glycaemic control (measured by HbA1c levels), which is in accordance with many previous reports. Also, presence of concomitant hypertension and smoking were important risk factors in early development of nephropathy. Therefore, regular screening for microalbuminuria in addition to continuous HbA1c estimation are important tools in the management of DM. Treatment of hypertension and aggressive lifestyle changes including measures to quit smoking should be given topmost priority. The rising prevalence of diabetes can produce major constraints on health care budget. This urgently calls for not only good control of diabetes to prevent nephropathy but also to address the larger issue of primary prevention of diabetes, that is, reduction in the prevalence of diabetes itself by aggressive lifestyle modifications. It was concluded that the prevalence of microalbuminuria in diabetic patients in this study was found to be as high, which needs of therapeutic and preventive measures. Being a developing country, there is a need of microalbuminuria and HbA1C testing in both newly diagnosed as well as already diagnosed type 2 diabetic patients as an early marker of renal risk factor. The present study emphazises education about strict glycaemic control and testing for microalbuminuria which is an early indicator of diabetic nephropathy, mandatory for all type 2 diabetic patients. Urinary microalbumin excretion correlated significantly with duration of diabetes. Increased HbA1c level positively correlated with microalbumin uria.
REFERENCES
|
||||||||||||||||||||||||||||||||||||||||||||||||||||||||||||||||||||||||||||||||||||||||||||||||||||||||||||||||||||||||||||||||||||||||||||||||||||||||||||||||||||||||||||||||||||||||||||||||||||||||||||||||||||||||||||||||||||||||||||||||||||||||||||||||||||||||||||||||||||||||||||||||||||||||||||||||||||
 Home
Home
