 Home
HomeOfficial Journals By StatPerson Publication
|
Table of Content - Volume 4 Issue 3 - December 2017
Urinary NGAL as an early marker of renal injury in Type II diabetics
Pavana A1*, K C Vasudha2, Pramila Karla3
{1Post Graduate, 2Professor, Department of Biochemistry} {3Professor, Department of Endocrinology} Ramaiah Medical College, Bangalore, Karanataka, INDIA. Email: drpavana7@gmail.com
Abstract Background: Microalbuminuria is a reversible stage of renal dysfunction in Diabetic patients and it’s detection allows early intervention thus checking its progress to ESRD. However, Microalbuminuria is transient and may vary in conditions such as fever, post-exercise, ingestion of plenty of water, diuresis, during acute illnesses and immediately after any surgery. A reliable biomarker is required therefore to diagnose early, reversible stage of renal dysfunction. Recent studies have shown Urinary Neutrophil Gelatinase Associated Lipocalin (UNGAL) as a reliable marker of renal injury. Objective: Was to estimate UNGAL and to evaluate its utility in the prediction of tubular and glomerular injury in normoalbuminuric Type 2 Diabetics. Materials and Methods: 40 normoalbuminuric Diabetics, 20 Microalbuminuric Diabetics and 20 clinically healthy controls visiting the Ramaiah Medical Hospital were included in the study. Exclusion criteria for this study was pregnancy, hypertension, patients with diseases of heart, prostrate, GIT, respiratory system and liver, other renal diseases and those on nephrotoxic drugs. Ethical clearance was obtained from the Institutional Ethical Board. After obtaining consent from patients, serum glucose, serum creatinine, HbA1c, Urinary albumin, Urinary creatinine and UNGAL was estimated. Results and Conclusion: Urinary ACR and UNGAL on comparison between the groups showed a significant difference. UNGAL showed a significant rise in the normoalbuminuric group with a P-value of <0.001 in comparison with controls suggesting it can be used as early screening marker for renal injury even before they progress to microalbuminuric stage. Key Words: Microalbuminuria, ESRD, normoalbuminuria, ACR, UNGAL.
Diabetes Mellitus is one of the major health concerns of India. Every fifth Diabetic of the world is an Indian.1 High blood glucose levels result in formation of Advanced Glycated End products and oxidative stress which lead to microvascular complications of Diabetes such as Nephropathy and Retinopathy.2 The early stage of Diabetic Kidney Disease is characterized by a small increase in urinary albumin excretion.3 Albuminuria is classified based on Albumin Creatinine Ratio (ACR) into normoalbuminuria (ACR <30 mg/ gm), microalbuminuria (ACR 30-300 mg/ gm) and macroalbuminuria (ACR >300 mg/ gm).4 It has been observed that patients with microalbuminuria subsequently develop macroalbuminuria [overt nephropathy] and later may progress to end stage renal disease (ESRD). Microalbuminuria is considered a reversible stage of nephropathy and if diagnosed early, treatment can be initiated to slow down the progress to overt nephropathy. It has been observed that a few individuals without albuminuria, may also progress to ESRD. By the time microalbuminuria set in, structural damage would have already occurred in the glomerulus to a certain extent. Microalbuminuria has been noted to be transient and may vary in certain states like fever, post-exercise, ingestion of plenty of water, diuresis, during acute illnesses and immediately after surgery. Usually a 24 hour urine sample is preferred for albumin estimation.5As most of these cases are diagnosed and treated on an out-patient basis, first void samples may be difficult to obtain. Random samples may not reflect transient microalbuminuria efficiently which may be another disadvantage.5 NGAL is a 25 kilo Dalton protein belonging to the lipocalin family and is also called human neutrophil lipocalin, 24p3 and Uterocalin.6NGAL was discovered in granules of neutrophils. It was found to bind siderophores and sequester iron,7,8 leading to restriction of bacterial infection.9 NGAL is also expressed in the lungs, trachea, salivary glands, stomach, intestine, prostrate. It has been implicated in processes such as apoptosis, tumorigenesis and cell differentiation.10In the adult kidney, NGAL applied to the cells of collecting duct lead to their proliferation and differentiation into tubular structures.11,12,13 It binds to two types of receptors, a brain-type organic cation transporter and Megalin receptor. The binding of NGAL to Megalin receptor leads to endocytosis of the ligand receptor complex. Megalin receptors are present in the proximal tubular cells of the kidney and are responsible for complete absorption of the filtered NGAL. Any NGAL present in the urine must be expressed in the distal tubular cells.14 This study was conducted to evaluate the usefulness of NGAL in detection of early renal changes in type 2 Diabetes. MATERIALS AND METHODS This study was conducted at Ramaiah Medical College and Hospital, after being approved by the Institution’s Ethical committee. 80 people were included in the study out of which 40 were normoalbuminuric Type 2 Diabetics (with ACR<30mg/gm of creatinine), 20 were Microalbuminuric Type 2 Diabetics (with ACR between 30 and 300 mg/gm of creatinine) and 20 were clinically healthy controls. The diagnosis of Diabetes was made according to ADA criteria of 2015.15 Exclusion criteria for this study were pregnancy, hypertension, patients with diseases of heart, prostrate, GIT, respiratory system, and liver, other renal diseases and those on nephrotoxic drugs and inflammatory diseases. After taking consent, a peripheral venous blood sample from each patient, was drawn into gel vacutainers taking aseptic precautions. The blood sample was allowed to clot and then centrifuged at 5000rpm for 8 minutes. The separated serum sample was processed for serum Creatinine (Alkalinepicrate - kinetic rate blanked; IFCC-IDMS standardized) and Serum Glucose (Hexokinase method) on RocheHitachi COBAS 6000 analyser. For HbA1c, blood was drawn into EDTA containing vacutainers and was estimated by HPLC method on Bio-Rad D-10 machine (HPLC method). The midstream urine samples were collected in sterile containers without any preservatives and were centrifuged for 8 minutes at 5000rpm. Urinary albumin and creatinine were estimated immediately by Immuno turbidimetric method and alkaline picrate- kinetic rate blanked (IFCC-IDMS standardized) method respectively, on Roche Hitachi COBAS 6000 analyser. eGFR was calculated from serum creatinine using the MDRD formula. Urine samples were aliquoted into sterile containers and stored at -80 degree centigrade up to a period of 6 months until UNGAL was estimated. Urinary NGAL was estimated using the ELISA kit bought from Immunology Consultants Laboratory, Inc. Kit E- 80NGL, Lot#5C1. Statistical Analysis: The results were analysed using SPSS software (Statistical Package for the Social Sciences) version 20 and Medcalc software. The continuous variables were summarized by employing descriptive statistics such as mean, standard deviation and interquartile range. All the categorical data were presented using numbers and percentages. The variables with parametric distribution like FBS, PPBS, serum creatinine, HbA1c and duration of DM were compared using one way Annova test. The comparisons of non-parametric variables like eGFR, ACR, UNGAL among the three groups was carried out using Kruskal Wallis test. The correlation between eGFR and urinary levels of NGAL and ACR was calculated using Spearman’s correlation. ROC curve was done to study the sensitivity and specificity of the markers. On statistical analysis the significance on analysis is interpreted as strongly significant (if P value≤0.01); Moderately significant (if P value> 0.01 to ≤ 0.05); Suggestive significance (if P value >0.05 to <0.1).
Table 1: Comparison of variables across the three groups
M: Mean SD: Standard Deviation. %: percentage All the three groups were well matched in gender distribution. There was no statistically significant difference between the three groups when age was compared. Fasting glucose and Post prandial glucose levels in comparison with the controls had a very significant difference statistically. Serum creatinine showed a significant difference when controls were compared with the other 2 groups. There was no statistically significant difference in the duration of Diabetes mellitus as well. HbA1c values were similar in the normoalbuminuric and microalbuminuric groups.
Table 2: Comparison of variables between the three groups
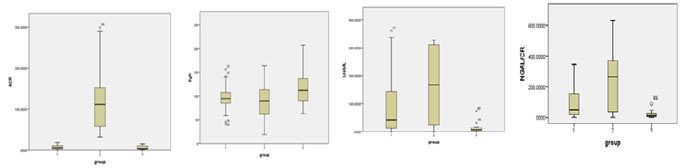
IQR:Interquartile range. A significant difference statistically was noted for MAU, ACR, UNGAL, UNGAL/CREATININE Ratio, while eGFR did not show any significant difference. Figure 1: Box plots comparing the median values of ACR, eGFR, UNGAL, UNGAL/Cr ratio The median values of ACR show a significant increase in comparison to controls but not in normoalbuminurics. The median values of eGFR show a significant decrease in microalbuminurics when compared to controls. The median values of UNGAL and UNGAL/creatinine are significantly high in the normoalbuminuric group than in the controls, while the rise in microalbuminurics is strongly significant. Table 3: Post Hoc for comparison of Renal Function Test variables between different groups
When microalbuminuric group was compared with controls using a post hoc test all the variables namely MAU, ACR, eGFR, UNGAL and UNGAL/ Cr showed a significant difference. But only UNGAL, UNGAL/Cr had a strongly significant difference in normoalbuminurics in comparison with the controls.
Table 4: Spearman’s Correlation for different variables
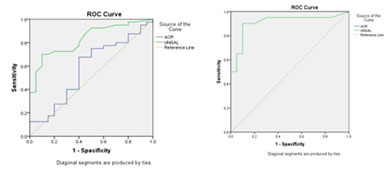
r: Correlation coefficient p: significance, **Correlation is strongly significant at the level of 0.01, *Correlation is moderately significant at the level of 0.05. In the study group MAU and ACR correlated positively with PPBS, serum creatinine, UNGAL and UTRANS and negatively with eGFR. UNGAL and UNGAL/Cr are positively correlated with FBS, PPBS, MAU, ACR, UTRANS and UTRANS/Cr but only UNGAL is negatively correlated with eGFR. UTRANS and UTRANS/Cr correlated positively with FBS, PPBS, MAU, ACR, UNGAL and UNGAL/Cr. Figure 2: ROC curves for UNGAL and ACR
Between Group 1 and 3 Between Group 2 and 3 (UNGAL: AUC was 0.828 (UNGAL: AUC was 0.909 ACR: AUC was 0.579) ACR: AUC was 1.000)
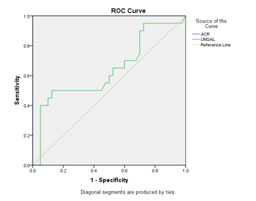
Figure 3: Between Group 1 and 2 (UNGAL: AUC was 0.639 ACR: AUC was 1.000)
DISCUSSION The comparison of means of age across the normoalbuminurics, microalbuminurics and controls did not show any statistical significant difference with a p-value of 0.84. (Table-1). The incidence of DM is becoming more common amongst the younger population which could be due to a more sedentary work life. The FBS and PPBS showed a significant difference in comparison to the controls with P- value of <0.001. The mean serum creatinine values in normoalbuminurics showed no significant difference when compared to the controls. But the microalbuminuric group showed a significant increase in serum creatinine when compared to controls with a P–value of 0.012 (Table-1), although the values are well within the biological reference range. An increase in serum creatinine is observed only when structural changes have already affected the kidney function. There is no gender bias observed in the disease scenario (Table-1).The duration of DM in both the normoalbuminurics and the microalbuminurics does not show any statistically significant difference with a P value of 0.645. Studies by Kundu D et al and Inassi J et al suggest the onset of microalbuminuria is associated with a longer duration of DM.16,17 The HbA1c levels in normoalbuminurics and microalbuminurics were similar and had a P-value of 0.621 on comparison, which was not significant. (Table-1) High HbA1c levels reflect poor control of blood glucose that lead to formation of AGEs which play a main role in the pathogenesis of microvascular complication of DM such as DN. The GFR was calculated using MDRD equation. The mean eGFR in normoalbuminurics and microalbuminurics was not significantly decreased in comparison to that of the controls.When individual groups were compared using a post hoc test, a very significant difference was noted when microalbuminurics were compared with controls but not when compared with normoalbuminurics. (Tables-3) The normoalbuminurics on comparison with controls expressed a significant difference with a P-value of 0.04. The mean eGFR level of normoalbuminuric individuals is in the normal reference range. This study noted a decrease in GFR in the normoalbuminurics in comparison with that of controls. MDRD formula is seen to under estimate GFR in the higher ranges but is very accurate when the range of GFR is below 60 ml per min.18 GFR is not only the basis for staging CKD, it also happens to be the basis for intervention in the form of haemodialysis. MAU and ACR showed a strong significant difference when compared across the 3 groups with a P-value of <0.001.(Table 2) The box plots show that median MAU and ACR levels do not rise when compared with the controls but the microalbuminuric group shows a significant rise in the median levels of the parameters. The individual groups were compared with each other. MAU and ACR between microalbuminurics and controls exhibited a strong statistically significant difference. But when the normoalbuminurics were statistically compared with the controls, MAU and ACR did not show any significance. Onset of Microalbuminuria in Type I DM is typically seen about 5 years after diagnosis but in Type 2 DM, it may be present at the time of diagnosis. Microalbuminuria reflects renal injury such as vascular damage, endothelial injury and inflammatory changes. The fenestrations in the glomerular filtration barrier are 60nm wide and the basement membrane has a negative charge which does not allow albumin to pass through. Normally some amount of albumin may get filtered through the glomerulus which gets absorbed in the PCT. When the transport mechanisms in the tubules are saturated it allows more protein to be excreted. The increase in pore size could be due to widening of the foot processes, and increase in mesangial matrix. The extra protein in the tubular fluid is found to cause further damage to the tubules. Microalbuminuria most often heralds the future occurrence of macroalbuminuria and ESRD. However, it is considered a reversible stage of renal dysfunction, as it can be effectively treated using ACE inhibitors.19,20 The median values of UNGAL and UNGAL/Creatinine ratio in normoalbuminuric group, microalbuminuric group showed a significant difference when compared with controls. The microalbuminurics showed a significant increase when compared with the normoalbuminurics (Table-3) This was very clearly evident in the boxplots charted in Figure 1 with a P-value of <0.001 indicative of strong significance. The comparison of the medians by post hoc analysis showed a statistically strong significant rise in UNGAL and UNGAL/Cr levels in the normoalbuminuric group and microalbuminuric group than in the controls with a P-value of <0.001. When normoalbuminurics were compared with microalbuminurics the increase in UNGAL showed suggestive significance with a P-value of 0.15 while UNGAL/Cr ratio showed a moderate significant rise with a P-value of 0.027. (Table-3) Assal H S et alin their study observed increase in the UNGAL levels in normoalbuminurics and microalbuminurics but also noted that the UNGAL values increased with the progression of the disease from normoalbuminuric to microalbuminuric and then to macroalbuminuric stages.21 Lacquaniti A et al, Nauta FL et al, Al-Rafai et al and Bolignano et al also have found a significant increase in Urinary NGAL levels in normoalbuminuric group as compared to controls.22,23,24,25 Jian Wu et al found a significant increase of UNGAL levels in macroalbuminuric group in comparison with controls but no significant rise in normoalbuminurics and microalbuminurics in comparison with the controls.26 Mahfouz MH et al found a significant increase in UNGAL levels in microalbuminuric and macroalbuminuric Diabetics in comparison with controls. Statistically significant rise was not noted in normoalbuminuric diabetics in comparison to the controls.27 In the total study group UNGAL and UNGAL/Cr has a positive correlation with FBS, PPBS, MAU, ACR. UNGAL correlates negatively with eGFR. In the normoalbuminuric group UNGAL and UNGAL/Cr did not show any significant correlation with other variables. In the microalbuminuric group UNGAL/Cr ratio correlates positively with ACR. Lacquaniti A et al found a positive correlation of UNGAL with Urinary ACR. Wu et al noted a positive correlation of UNGAL with urinary ACR, BUN and serum creatinine.3 A study by Nauta et al observed a negative correlation of NGAL with eGFR.28 In a prospective study done by Chou et al an increase in UNGAL levels were found with progression of the disease that correlated well with declining eGFR.29 Al-Rafai et al found a strong negative correlation between UNGAL and eGFR and a positive correlation with HbA1c but did not find any correlation with ACR.24 Rubeaan et al found a positive correlation between UNGAL and urinary ACR and also associated it with poor glycaemic control.30 In this study it is evident that the increase in UNGAL in normoalbuminuric group was strongly significant when compared with controls. The increase in UNGAL was even more pronounced in microalbuminuric group when compared with controls. UNGAL correlated well with ACR in the microalbuminuric stage but not in the normoalbuminuric stage which suggests that the increase in UNGAL was independent of the increase in urinary ACR. It also indicates that tubular injury that led to the rise in UNGAL can precede glomerular injury. ROC for normoalbuminurics vs controls showed an area under the curve for ACR was 0.579 (at a cut off value of >3.59 mg/g when sensitivity was 67.5% and specificity was 60% within 95% confidence interval). For UNGAL, AUC was 0.828 (very good significance at a cut off value of >17ng/ml with a sensitivity of 70% and specificity of 90% within 95% confidence interval). A comparative ROC showed that the difference between ACR and UNGAL was significant with a P value of 0.012; Based on ROC and the AUC, it may be inferred that, UNGAL is a better predictor of early renal injury as compared to ACR. ROC for microalbuminuric vs controls showed an area under the curve for ACR was 1.000 (at a cut off value of 14.8mg/g, with a sensitivity of 100% and specificity of 100% within 95% confidence interval). For UNGAL, AUC was 0.909 (very good significance at a cut off value of >17ng/ml with a sensitivity of 90% and specificity of 90% within 95%confidence interval). Here the comparison of ROC did not show any significant difference between UNGAL and ACR (P value of 0.08), This indicates that the two analytes may be equal contenders as markers of microalbuminuria. ROC for normoalbuminurics vs microalbuminurics showed an area under the curve for ACR of 1.000 (excellent marker at a cut off value of 18.49 mg/g, with a sensitivity of 100% and specificity of 100% within 95% confidence interval). For UNGAL, AUC was 0.639 (at a cut off value of 270ng/ml, sensitivity was 87.50% and specificity was 50% within 95%confidence interval).The comparative ROC between ACR and UNGAL showed a significant difference in the area under the curve with a P value of<0.001. NGAL is a 25kilodalton protein which belongs to the family of Lipocalins which are involved in transporting hydrophobic molecules, plays a role in inflammation and in synthesis of prostaglandins. NGAL was first observed to be expressed in neutrophils in association with Gelatinase component. Since then NGAL has been noted to be expressed in various tissue such as trachea, lung, salivary glands, stomach, colon, prostrate and recently the role of NGAL in screening for acute kidney injury is well established. In one of the studies involving the IgA Nephropathy UNGAL levels were found to be raised in Lee grade 3 where tubular expression of NGAL was noted on a biopsy examination.31 Whenever there is tubular interstitial injury with a relatively spared intact glomerular basement membrane, NGAL predominantly accumulates in the epithelial cells of the proximal tubules where it is believed to play a role in healing/ induction of re-epithelialization. Normally NGAL produced by the neutrophils is freely filtered. The filtered NGAL is completely absorbed by the proximal convoluted tubular cells. Hence proximal tubular injury would result in increased NGAL excretion by reduced tubular reabsorption. Further NGAL mRNA expression and production is upregulated in the distal convoluted tubule and the collecting duct during tubular stress. These mutually enhancing effects may result in excessive excretion of NGAL in the normoalbuminuric stage. As the disease progresses to the stage of microalbuminuria associated with damaged glomerular basement membrane, albumin is also filtered in excess. Proteins normally are reabsorbed after filtration in the PCT. Albumin is filtered through the glomerulus with a sieving coefficient of 0.00062 which results in approximately 3.3g of albumin filtered daily in the human kidneys. The PCT reabsorbs 71%, loop of Henle and DCT 23% and collecting duct, the remaining 3% of the filtered albumin. On the other hand low molecular weight proteins like NGAL are freely filtered at the glomerulus with a sieving coefficient of 0.987 and normally 9.6g of these proteins are reabsorbed per day. In the phase of microalbuminuria, with an already compromised number of Megalin transporters in the renal tubules, there is perhaps a preferential reabsorption of NGAL and other small molecular weight proteins in comparison to albumin. Hence the progressive increase in excretion of NGAL in this stage in comparison to albumin may not be well appreciated. Many studies have shown an increase in NGAL excretion with the onset of macroalbuminuria. This may be because of tubular atrophy, loss of Megalin proteins and therefore no reabsorption of either albumin or low molecular proteins like NGAL.19,20,32
CONCLUSION Microalbumin is the present marker used for screening of DKD but it has its limitation in detection. This study evaluated the usefulness of urinary NGAL in predicting the structural changes in the normoalbuminuric Diabetics, a vulnerable group who can progress to the stage of microalbuminuria, if an early detection is not attempted. The absence of microalbuminuria does not imply that the patient is safe from a progressive decline in GFR. If an emphasis is placed only on increased albumin levels, while diagnosing and treating Diabetic Nephropathy it may lead, either to under treatment or over treatment. Therefore other markers which may reflect on the ongoing process of damage in different parts of the nephron have to be included in the diagnostic profile. In the normoalbuminuric range only urinary NGAL was significantly elevated implying that it was able to detect the impending structural damage which urinary albumin was not able to. Urinary NGAL may serve this purpose better if included in the screening profile for Diabetic Kidney Disease.
REFERENCES
|
 This work is licensed under a Creative Commons Attribution-NonCommercial 4.0 International License.