 Home
HomeOfficial Journals By StatPerson Publication
|
Table of Content - Volume 5 Issue 1 - January 2018
Comparison of Lipoprotein(a) value with lipid profile in subject of age group 20 – 40 years in rural and urban population of Kishanganj district
Sheereen Tarannum1, Khalid Ansari2*
1Associate Professor, 2PG Student, Department of Biochemistry, M.G.M. Medical College and LSK, Hospital, Kishanganj 855107, Bihar. Email: kajal6160@gmail.com
Abstract Problem Statement: Genetic Studies and numerous epidemiological studies have identified Lp(a) as a risks factor for atherosclerotic disease such as coronary heart disease and stroke. The Lp (a) Induced increased risk factor of CVD may be mediated by both its proatherogenic and prothrombotic mechanism. Methods: This study was conducted in the department of Biochemistry and medicine ward in M.G.M. medical college and L.S.K. Hospital Kishanganj, Bihar. It was case study. The duration of study was from December 2015 to September 2017. The study group comprises fifty-fifty individual cases of 20-40 years age group from rural and urban area having no chronic disease included in the study after following the exclusion and inclusion criteria. Results: We divided all 50 patients each in 20 – 30 years and 31 – 40 years of age group from rural and urban area, showing that in this study rural and urban area consists 50 patients (100%) each. in urban area 26% (13) male patients belong from 20-30 years of age group and 42 % (21) male patients belong from 31-40 years of age group. Likewise 14% (7) and 18% (9) female patients belong from 20-30 years of age group and 31-40 years of age group respectively in urban area. On the other hand in rural area 28% (14) and 30% (15) male patients belong from 20-30 years and 31-40 years of age group respectively. The percentage for the female patients belong from rural area for 20-30- years and 31-40 years of age group is 16% (8) and 26 % (13) respectively. Conclusion: “comparison of lipoprotein(a) value lipid profile in subject of age group 20-40 years in rural and urban population ;” we tried to evaluate and correlate the value of Lp(a) and lipid profile in different age group and different areas(rural and urban). As Discussed earlier the increase in Lp(a) is directly proportional to increase in cholesterol, LDL and triglyceride. Furthermore, we have seen that their value is higher in urban population as compeered to rural population. Which may be due to difference in life style and food habit. Key Words: Coronary heart disease, Atherosclerosis, Lipoprotein (a), CVD.
Lipoproteins are the particles that transport cholesterol and triglycerides in the blood stream. Lipoproteins are composed of proteins (apolipoproteins), phospholipids, triglycerides and cholesterol. The lipoproteins vary in the major lipoprotein present and the relative contents of the different lipid components. Lp(a) is a lipoprotein rich in cholesterol. It differs from LDL as it contains an additional protein, apolipoprotein (a). Similar to LDL, a Lp(a) particle also contains one molecule of apolipoprotein B. It as assumed that Lp(a) is produced by liver cells. However, the pathways for the clearance of this substance are not clearly understood. Plasma levels of Lp(a) rise shortly after birth and the levels appear to become consistent within a few months. Typical distributions of Lp(a) in Caucasians are shown in plasma levels of Lp(a) are similar in men and women and are skewed in the population with a tail towards the highest levels. Levels are lowest in non-Hispanic Caucasians (e.g. median: 12 mg/dL; inter-quartile range: 5–32),1 Blood levels of Lipoprotein(a) or Lp(a) may be an important marker for the risk development of heart disease. However, measurements of Lp(a) are not widely available and are seldom used in routine clinical practice. Measurements of lipids levels are frequently used to assess the risk of future coronary heart disease or stroke. These two disease conditions are commonly termed cardiovascular disease (CVD) Blood levels of total cholesterol, triglycerides and high-density lipoprotein cholesterol (HDL-C) are measured when assessing a standard lipid panel. These numbers are then used to calculate low-density lipoprotein cholesterol (LDL-C), which has been found to be strongly correlated with the risk of CVD. Recently measures of lipoprotein particles involved in atherosclerosis, which is the leading underlying cause of CVD, have been found to be very useful to assess risk. Examples of such measurements are LDL particle number (LDL-P), apolipoprotein B and Lipoprotein(a). Lp(a) is a strong risk factor for CVD. However, the lack of clinical trial data has resulted in Lp(a) being largely ignored by clinical guidelines assessing the prevention of CVD. In 2010, the European Atherosclerosis Society (EAS) consensus panel recommended screening for elevated Lp(a), in people with moderate to high risk of cardiovascular disease. Desirable Lp(a) levels < 50 mg/dL were considered a treatment priority, after therapeutic management of LDL-C.1-3 Lp(a) and LDL penetrate the inner layer of the arterial wall and accumulate together at sites for atherosclerotic plaque formation. Evidence suggests that Lp(a) may be more firmly retained in the arterial wall than LDL. Furthermore, Lp(a) transports oxidized phospholipids whose plasma levels are strongly correlated with the severity of coronary artery disease. Interestingly, these Lp(a) associated oxidized phospholipids possess proinflammatory activity. This might be one of the links between lipids and inflammation in atherosclerosis. There is also some experimental data suggesting that Lp(a) may promote clot formation in arteries burdened by atherosclerotic plaque. This may be one of the mechanisms behind the involvement of Lp(a) in heart attack and stroke.4 Meta-analysis of 66 studies on the effects of physical activity on lipid and lipoprotein metabolism demonstrated that TC, LDL-C, TG and TC/HDL-C ratio significantly decrease after training5. It has been reported that the increases in HDL-C levels induced by exercise training were inversely related to baseline HDL-C levels. These findings suggested that individuals with the lowest HDL-C levels would exhibit the greatest increases in HDL-C with exercise6. The magnitude of the observed changes in these values depend on age, sex, body weight, body fat content, duration and intensity of exercise7. The effect of exercise on fat metabolism shows differences between sexes. Meta analysis revealed that HDL-C and LDLC levels in females didn't significantly change during training, because the HDL-C levels were high in females irrespectively of training status8. Plasma LDL-C levels were repeated to be higher in body builders than in cyclists and long distance runners, while HDL-C levels were found to be the highest in runners and the lowest in body builders. In the body builders who use anabolicsteroids and got livers damage the HDL-C levels were found to be low and LDL-C levels to be high9.
MATERIAL AND METHODS Comparison of Lipoprotein (a) value with Lipid Profile in subject of age group 20 – 40 years in rural and urban population, This study was conducted in the department of Biochemistry and medicine ward in MGM medical college and L.S.K. Hospital Kishanganj, Bihar. Type of Study: Case study. Study Area : The subjects were chosen from the OPD in the dept. of Medicine. M.G.M. Medical College and L.S.K. Hospital, Kishanganj, Bihar. Study Duration: The duration of study was from December 2015 to September 2017. Study population and sampling frame: A synopsis of this research study design consists of Introduction, Aims and Objectives and protocol were submitted for approval after getting the permission from the Ethical Committee, M.G.M. Medical College and L.S.K. Hospital, Kishanganj, Bihar. Eligibility of the study population: The study group comprises fifty individual cases of 20-40 years age group from rural and urban area having no chronic disease included in the study after following the exclusion and inclusion criteria. We divided fifty patients in two age groups i.e. 20-30 years age group and 31-40 years age group. A short history and clinical examination of the patients were obtained regarding the height, weight, blood pressure, history of smoking, alcohol intake and after taking the verbal consent of the patient the blood samples were collected and the blood samples were tested in the department of Biochemistry, M.G.M. Medical College and L.S.K. Hospital, Kishanganj, Bihar. Samples were collected for estimation of
Very low-density lipoprotein (VLDL) is to be calculating used of Friedewald's formula. Serum Lp(a) estimated is performed using quantitative Latex- enhanced Immunoturbidimetric test using human Lp(a) kit on Selectra-pro-S auto analyzer. Strict external quality control using sera with known values will be performed to validate the results. Inclusion Criteria: The study group of 20-40 years of rural and urban area respectively having no chronic disease. Exclusion Criteria: The patients were excluded from the study of diabetes, hypertension, any hormonal imbalance etc. Main Instrument: All the biochemical parameters were performed in full automated analyzer (Selectra Pro S).
RESULTS
Table 1: Urban and Rural area wise Distribution
Table no-1 showing that in this study rural and urban area consists 50 patients (100%) each Table 2: Age and Sex wise Distribution
Table no: 2 showing that in urban area 26% (13) male patients belong from 20-30 years of age group and 42 % (21) male patients belong from 31-40 years of age group. Likewise 14% (7) and 18% (9) female patients belong from 20-30 years of age group and 31-40 years of age group respectively in urban area. On the other hand in rural area 28% (14) and 30% (15) male patients belong from 20-30 years and 31-40 years of age group respectively. The percentage for the female patients belong from rural area for 20-30- years and 31-40 years of age group is 16% (8) and 26 % (13) respectively.
Table 3: Age and Sex wise distribution of smoker in Urban and Rural area oriented patients
Table no: 3 showing that urban area consists 18% (9) male patients belong from 20-30 years of age group and 22% (11) male patients belong from 31-40 years of age group were smoker. No female patients were found in urban area who were smoker. On the other hand rural area consists 14% (7) and 18% (9) male patients belong from 20-30 years and 31-40 years of age group respectively were smokers. In rural area only 4% (2) female patients were found to be smokers and all of them belong to 31-40 years of age group.
Table- 4: Age and Sex wise distribution of Non smoker in Urban and Rural area oriented patients
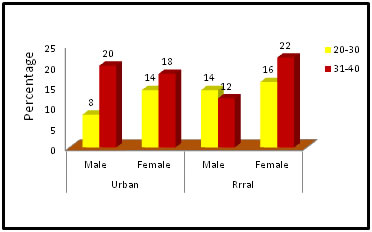
Figure: 4: Age and Sex wise distribution of Non smoker in Urban and Rural area oriented patients
Table no: 4 showing that urban area consists 8% (4) male patients belong from 20-30 years of age group and 20 % (10) male patients belong from 31-40 years of age group were non smoker. In female patients the percentage for non smokers were 14% (7) and 18% (9) for 20-30years and 31-40 years of age group respectively in urban area. Likewise rural area consists 14% (7) and 12% (6) male patients belong from 20-30 years and 31-40 years of age group respectively were non smokers. In rural area 16% (8) and 22% (11) female patients were found to be non smokers in 20-30 years and 31-40 years of age group respectively.
Table 5: Area, Age and Sex wise distribution of Alcoholic and patients
Table no: 5 showing that urban area consists 2% (1) male patients belong from 20-30 years of age group and 6 % (3) male patients belong from 31-40 years of age group were Alcoholic. No female patients were found in urban area who were Alcoholic. On the other hand rural area consists 8% (4) and 18% (9) male patients belong from 20-30 years and 31-40 years of age group respectively were Alcoholic. In rural area only 2% (1) and 4% (2) female patients were found to be Alcoholic in 20-30 years and 31-40 years of age group respectively. Rest of the patients were found to be not Alcohol abused.
Table- 6: Age and sex wise distribution of Urban and Rural area oriented patients among High value of Cholesterol
Table no: 6 showing that urban area consists 18% (9) male patients belong from 20-30 years of age group and 26 % (13) male patients belong from 31-40 years of age group were suffering from high cholesterol level. In female patients the percentage for high cholesterol level were 4% (2) and 10% (5) for 20-30years and 31-40 years of age group respectively in urban area. Likewise rural area consists 12% (6) and 14% (7) male patients belong from 20-30 years and 31-40 years of age group had high cholesterol level respectively. In rural area 4% (2) and 8% (4) female patients were suffering from high cholesterol level in 20-30 years and 31-40 years of age group respectively. Table 7: Age and sex wise distribution of Urban and Rural area oriented patients among Normal value of Cholesterol
From the above table (No:7) we found that in urban area 8% (4) male and 10% (5) female patients belong from 20 – 30 years age group and 16% (8) male and 8% (4) female patients belong from 31-40 years of age group who has normal value of cholesterol respectively. On the other hand in rural area 16% (8) male and 12% (6) female patients belong from 20 – 30 years age group and 16% (8) male and 18% (9) female patients belong from 31-40 years of age group who has normal value of cholesterol respectively.
Table 8: Age and sex wise distribution of Urban and Rural area oriented patients among High value of Triglyceride
Table no 8 showing the age and sex wise distribution of high value of Triglyceride in urban and rural area. From the above table we found that 20-30 years of age group consists 16% (8) male, 4% (2) female in urban area and 12% (6) male and 6% (3) female patients in rural area have high value of triglyceride. In the 31-40 years of age group 30% (15) male and 12% (6) female in urban area and 18% (9) male 8% (4) female patients in rural area are suffering from high triglyceride level respectively.
Table 9: Age and sex wise distribution of Urban and Rural area oriented patients among Normal value of Triglyceride
Table no 9 showing the age and sex wise distribution of normal value of Triglyceride in urban and rural area. From the above table we found that 20-30 years of age group consists 10% (5) male, 10% (5) female in urban area and 16% (8) male and 10% (5) female patients in rural area have normal value of triglyceride. In the 31-40 years of age group 12% (6) male and 6% (3) female in urban area and 12% (6) male and 18% (9) female patients in rural area have normal level of triglyceride. Table 10: Age and sex wise distribution of Urban and Rural area oriented patients among Low value of HDL.
Table no 10 showing the age and sex wise distribution of low value of HDL in urban and rural area. From the above table we found that 20-30 years of age group consists 8% (4) male, 2% (1) female in urban area and 8% (4) male and 2% (1) female patients in rural area have low value of HDL. In the 31-40 years of age group 16% (8) male and 4% (2) female in urban area and 10% (5) male and 4% (2) female patients in rural area have low level of HDL.
Table 11: Age and sex wise distribution of Urban and Rural area oriented patients among Normal value of HDL
Table no 11 showing the age and sex wise distribution of normal value of HDL in urban and rural area. From the above table we found that 20-30 years of age group consists 18% (9) male, 12% (6) female in urban area and 20% (10) male and 14% (7) female patients in rural area have normal value of HDL. In the 31-40 years of age group 26% (13) male and 14% (7) female in urban area and 20% (10) male and 22% (11) female patients in rural area have normal level of HDL.
Table 12: Age and sex wise distribution of Urban and Rural area oriented patients among High value of LDL.
Table no 12 showing the age and sex wise distribution of high value of LDL in urban and rural area. From the above table we found that 20-30 years of age group consists 10% (5) male, 4% (2) female in urban area and 8% (4) male and 2% (1) female patients in rural area have high value of LDL. In the 31-40 years of age group 16% (8) male and 6% (3) female in urban area and 12% (6) male 6% (3) female patients in rural area are suffering from high LDL level respectively.
Table- 13: Age and sex wise distribution of Urban and Rural area oriented patients among Normal value of LDL.
Table no 13 showing the age and sex wise distribution of normal value of LDL in urban and rural area. From the above table we found that 20-30 years of age group consists 16% (8) male, 10% (5) female in urban area and 20% (10) male and 14% (7) female patients in rural area have normal value of LDL. In the 31-40 years of age group 26% (13) male and 12% (6) female in urban area and 18% (9) male and 20% (10) female patients in rural area have normal level of LDL.
Table 14: Age and sex wise distribution of Urban and Rural area oriented patients among High value of Lipoprotein (a).
Table no 14 showing the age and sex wise distribution of high value of Lipoprotein (a) in urban and rural area. From the above table we found that 20-30 years of age group consists 20% (10) male and 6% (3) female patients in both urban area and 14% (7) male patients and 4% (2) female patients in rural area have high value of Lipoprotein (a). In the 31-40 years of age group 26% (13) male and 10% (5) female in urban area and 14% (7) male 8% (4) female patients in rural area have high Lipoprotein(a) level respectively.
Table 15: Age and sex wise distribution of Urban and Rural area oriented patients among Normal value of Lipoprotein (a)
Table no 15 showing the age and sex wise distribution of normal value of Lipoprotein (a) in urban and rural area. From the above table we found that 20-30 years of age group consists 6% (3) male, 8% (4) female in urban area and 14% (7) male and 12% (6) female patients in rural area have normal value of Lipoprotein (a). In the 31-40 years of age group 16% (8) male and 8% (4) female in urban area and 16% (8) male and 18% (9) female patients in rural area have normal level of Lipoprotein(a).
Table 16: Comparison between Lipid Profile and Lipoprotein(a) in age group of 20-40 years.
As the aim of our study was to compare the value of Lipoprotein (a) and lipid profile we have done a correlation between them. Table no-16 showing the correlation between Lp(a) and Lipid profile and we found all the results statistically significant. The Mean value and +SD is mentioned in table no 16. DISCUSSION Comparison of Lipoprotein(a)value with Lipid Profile in subject of age group 20 – 40 years in rural and urban population, This study was conducted in the department of Biochemistry and medicine ward in MGM medical college and L.S.K. Hospital Kishanganj, Bihar. We divided all 50 patients each in 20 – 30 years and 31 – 40 years of age group from rural and urban area. Table no-1 showing that in this study rural and urban area consists 50 patients (100%) each. When the lipid levels are compared between males and females of corresponding age groups, it is seen that lipid levels varies between males and females of corresponding age group. It is in agreement with the study conducted by Nestruck et al in 1986, who found that lipid levels vary between males and females of comparable age groups[10]. All lipid levels except HDL-C is higher in males compared to females of corresponding age groups. TC/HDL-c and LDL-c/HDL-c are also high in males of the corresponding age group. Upon statistical analysis the difference in values between the sexes of comparable age group is not significant with respect to all parameters although most of the values show statistical significance. In 1989 Mathews et al found that total cholesterol, LDL-c and triglyceride in males are higher than in females of corresponding premenopausal group but HDL-c is higher in females11. Table no: 2 showing that in urban area 26% (13) male patients belong from 20-30 years of age group and 42 % (21) male patients belong from 31-40 years of age group. Likewise 14% (7) and 18% (9) female patients belong from 20-30 years of age group and 31-40 years of age group respectively in urban area. On the other hand in rural area 28% (14) and 30% (15) male patients belong from 20-30 years and 31-40 years of age group respectively. The percentage for the female patients belong from rural area for 20-30- years and 31-40 years of age group is 16% (8) and 26 % (13) respectively. Table no: 3 showing that urban area consists 18% (9) male patients belong from 20-30 years of age group and 22 % (11) male patients belong from 31-40 years of age group were smoker. No female patients were found in urban area who were smoker. On the other hand rural area consists 14% (7) and 18% (9) male patients belong from 20-30 years and 31-40 years of age group respectively were smokers. In rural area only 4% (2) female patients were found to be smokers and all of them belong to 31-40 years of age group. Table no: 4 showing that urban area consists 8% (4) male patients belong from 20-30 years of age group and 20 % (10) male patients belong from 31-40 years of age group were non smoker. In female patients the percentage for non smokers were 14% (7) and 18% (9) for 20-30years and 31-40 years of age group respectively in urban area. Likewise rural area consists 14% (7) and 12% (6) male patients belong from 20-30 years and 31-40 years of age group respectively were non smokers. In rural area 16% (8) and 22% (11) female patients were found to be non smokers in 20-30 years and 31-40 years of age group respectively. Table no: 5 showing that urban area consists 2% (1) male patients belong from 20-30 years of age group and 6 % (3) male patients belong from 31-40 years of age group were Alcoholic. No female patients were found in urban area who were Alcoholic. On the other hand rural area consists 8% (4) and 18% (9) male patients belong from 20-30 years and 31-40 years of age group respectively were Alcoholic. In rural area only 2% (1) and 4% (2) female patients were found to be Alcoholic in 20-30 years and 31-40 years of age group respectively. Rest of the patients were found to be not Alcohol abused. Table no: 6 showing that urban area consists 18% (9) male patients belong from 20-30 years of age group and 26 % (13) male patients belong from 31-40 years of age group were suffering from high cholesterol level. In female patients the percentage for high cholesterol level were 4% (2) and 10% (5) for 20-30years and 31-40 years of age group respectively in urban area. Likewise rural area consists 12% (6) and 14% (7) male patients belong from 20-30 years and 31-40 years of age group had high cholesterol level respectively. In rural area 4% (2) and 8% (4) female patients were suffering from high cholesterol level in 20-30 years and 31-40 years of age group respectively. From the above table (No:7) we found that in urban area 8% (4) male and 10% (5) female patients belong from 20 – 30 years age group and 16% (8) male and 8% (4) female patients belong from 31-40 years of age group who has normal value of cholesterol respectively. On the other hand in rural area 16% (8) male and 12% (6) female patients belong from 20 – 30 years age group and 16% (8) male and 18% (9) female patients belong from 31-40 years of age group who has normal value of cholesterol respectively. Table no 8 showing the age and sex wise distribution of high value of Triglyceride in urban and rural area. From the above table we found that 20-30 years of age group consists 16% (8) male, 4% (2) female in urban area and 12% (6) male and 6% (3) female patients in rural area have high value of triglyceride. In the 31-40 years of age group 30% (15) male and 12% (6) female in urban area and 18% (9) male 8% (4) female patients in rural area are suffering from high triglyceride level respectively. Table no 9 showing the age and sex wise distribution of normal value of Triglyceride in urban and rural area. From the above table we found that 20-30 years of age group consists 10% (5) male, 10% (5) female in urban area and 16% (8) male and 10% (5) female patients in rural area have normal value of triglyceride. In the 31-40 years of age group 12% (6) male and 6% (3) female in urban area and 12% (6) male and 18% (9) female patients in rural area have normal level of triglyceride. Table no 10 showing the age and sex wise distribution of low value of HDL in urban and rural area. From the above table we found that 20-30 years of age group consists 8% (4) male, 2% (1) female in urban area and 8% (4) male and 2% (1) female patients in rural area have low value of HDL. In the 31-40 years of age group 16% (8) male and 4% (2) female in urban area and 10% (5) male and 4% (2) female patients in rural area have low level of HDL. Table no 11 showing the age and sex wise distribution of normal value of HDL in urban and rural area. From the above table we found that 20-30 years of age group consists 18% (9) male, 12% (6) female in urban area and 20% (10) male and 14% (7) female patients in rural area have normal value of HDL. In the 31-40 years of age group 26% (13) male and 14% (7) female in urban area and 20% (10) male and 22% (11) female patients in rural area have normal level of HDL. Table no 12 showing the age and sex wise distribution of high value of LDL in urban and rural area. From the above table we found that 20-30 years of age group consists 10% (5) male, 4% (2) female in urban area and 8% (4) male and 2% (1) female patients in rural area have high value of LDL. In the 31-40 years of age group 16% (8) male and 6% (3) female in urban area and 12% (6) male 6% (3) female patients in rural area are suffering from high LDL level respectively. Table no 13 showing the age and sex wise distribution of normal value of LDL in urban and rural area. From the above table we found that 20-30 years of age group consists 16% (8) male, 10% (5) female in urban area and 20% (10) male and 14% (7) female patients in rural area have normal value of LDL. In the 31-40 years of age group 26% (13) male and 12% (6) female in urban area and 18% (9) male and 20% (10) female patients in rural area have normal level of LDL. Total cholesterol, LDL-C and triglyceride increases; ratios between TC/HDL-C and LDL-C/HDL-C also increases. But HDL-C shows a decrease in both the sexes. This is in agreement with several previous studies. Ndomou et al in 1999 showed that all lipid fractions except HDL-C concentration increased significantly with age 12. Study by Gupta et al in 1994 also showed, age relates positively with total cholesterol, LDL-C and triglyceride levels in both sexes8. Levels of serum cholesterol, LDL-C, triglyceride and the ratios of TC/HDL-C and LDL-C/HDL-C are directly related with the risk of CAD13, while HDL-C correlates inversely with the risk of CAD10. The present study gain importance because of the above relation. The increase in lipids with advancing age increases the risk for CAD. Table no 14 showing the age and sex wise distribution of high value of Lipoprotein (a) in urban and rural area. From the above table we found that 20-30 years of age group consists 20% (10) male and 6% (3) female patients in both urban area and 14% (7) male patients and 4% (2) female patients in rural area have high value of Lipoprotein (a). In the 31-40 years of age group 26% (13) male and 10% (5) female in urban area and 14% (7) male 8% (4) female patients in rural area have high Lipoprotein(a) level respectively. Table no 15 showing the age and sex wise distribution of normal value of Lipoprotein(a) in urban and rural area. From the above table we found that 20-30 years of age group consists 6% (3) male, 8% (4) female in urban area and 14% (7) male and 12% (6) female patients in rural area have normal value of Lipoprotein(a). In the 31-40 years of age group 16% (8) male and 8% (4) female in urban area and 16% (8) male and 18% (9) female patients in rural area have normal level of Lipoprotein(a). As the aim of our study was to compare the value of Lipoprotein(a) and lipid profile we have done a correlation between them. Table no-16 showing the correlation between Lp(a) and Lipid profile and we found all the results statistically significant. The Mean value and +SD is mentioned in table no 16. As the aim of our study was to compare the value of Lipoprotein(a) and lipid profile we have done a correlation between them. Table no-16 showing the correlation between Lp(a) and Lipid profile and we found all the results statistically significant. The Mean value and +SD is mentioned in table no 16. The Mean value is 214, +SD is 73.1 and p Value = <0.697 for age group from rural and urban area population. We found the Mean value of cholesterol was 204.3, +SD is 92.1 and p Value = <0.05 for Triglyceride, the Mean value was 41.5, +SD is 7.27 and p Value = <0.05 for high density lipoprotein, the Mean value was 132.1, +SD is 57.5 and p Value = <0.05 for low density lipoprotein, the Mean value was 49.8, +SD is 16.9 and p Value = <0.05 for very low density lipoprotein, the Mean value is 27.9, +SD is 7.78 and p Value = <0.05 for Lp(a). According to the Framingham Heart Study 1949 -1979 risk for atherosclerosis is increased with an increase in the serum cholesterol and triglyceride levels. Various studies like national cholesterol education program 1988, Keys et al, 1970; Reckless et al, 1978 showed a strong positive association between atherosclerosis and LDL-C14-16. According to Gordon et al, 1977, the levels, of LDL-C are more closely associated with CAD. LDL particle must undergo oxidative modification before they become pathogenic17. The oxidized LDL molecules lead to endothelial cell or vessel wall dysfunction which is associated with the development of atherosclerosis. Barr et al, 1951 proved that elevated levels of HDL-C are predictive of protection from atherosclerotic cardiovascular disease18. Alber’s et al, 1976; Narula et al, 1985 emphasized that total cholesterol; LDL-C and triglyceride have a positive relation with atherosclerosis19,20 HDL-C transports free cholesterol from blood to liver, thus removing free cholesterol from circulation, so that cholesterol deposition inside the walls of blood vessels is minimized. CONCLUSION Genetic Studies and numerous epidemiological studies have identified Lp(a) as a risks factor for atherosclerotic disease such as coronary heart disease and stroke. The Lp (a) Induced increased risk factor of CVD may be mediated by both its proatherogenic and prothrombotic mechanism. In The Present study, “that is comparison of lipoprotein (a) value lipid profile in subject of age group 20-40 years in rural and urban population ;” we tried to evaluate and correlate the value of Lp(a) and lipid profile in different age group and different areas(rural and urban). As Discussed earlier the increase in Lp(a) is directly proportional to increase in cholesterol, LDL and triglyceride. Furthermore, we have seen that their value is more in higher age group and in urban population which may be due to difference in life style and food habit. As the robust and specific association between elevated Lp(a) Level and increased CVD/CHD Indicate that elevated Lp(a) like elevated LPL-Cholesterol is casually related to premature CVD/CHA we can use these parameter to screen the population at risk of developing CVD/CHD, So that they can be diagnosed and treated as early as possible.
REFERENCES
|
|||||||||||||||||||||||||||||||||||||||||||||||||||||||||||||||||||||||||||||||||||||||||||||||||||||||||||||||||||||||||||||||||||||||||||||||||||||||||||||||||||||||||||||||||||||||||||||||||||||||||||||||||||||||||||||||||||||||||||||||||||||||||||||||||||||||||||||||||||||||||||||||||||||||||||||||||||||||||||||||||||||||||||||||||||||||||||||||||||||||||||||||||||||||||||||||||||||||||||||||||||||||||||||||||||||||||||||||||||||||||||||||||||||||||||||||||||||||||||||||||||||||||||||||||||||||||||||||||||||||||||||||||||||||||||||||||||||||||||||||||||||||||||||||||||||||||||||||||||||||||||||||||||||||||||||||||||||||||||||||||||||||||||||
 This work is licensed under a Creative Commons Attribution-NonCommercial 4.0 International License.