 Home
HomeOfficial Journals By StatPerson Publication
|
Table of Content - Volume 6 Issue 1 - April 2018
Correlation of Thyroid Hormones with Vitamin D Status in Acutely Ill Children
Aruna Kumari Bandaru1, Srinivas Reddy Gurrala2*,Vanumu Divya Sai3
1Associate Professor, 2Assistant Professor, Department of Biochemistry, Government Medical College, Mahabubnagar, Telangana- 509001. 3Final MBBS student, Siddhartha Medical College, Vijayawada, Andhra Pradesh-520008, INDIA. Email: varunakumari@gmail.com
Abstract Objective: The aim of the study is to correlate thyroid function tests with vitamin D status and the existence of “Euthyroid Sick Syndrome (ESS)”, in acutely ill children. Methods: The present case-control study was conducted on 120 children from one to five year age groups. Out of which, 50 were healthy euthyroid children as controls and 70 were acutely ill children admitted in ICU were included. The serum total T3, T4, TSH and 25 (OH) D were estimated and compared to relate vitamin D status with the thyroid profile. Results: Out of the total 120 study cases, 45% were vitamin D deficient, 22.5% were vitamin D insufficient, and 32.5% had sufficient vitamin D. The prevalence of vitamin D deficiency was significantly more in ESS than euthyroid children (88.9% vs 11.1%, p<0.0001). The mean of total T3 (1.06 vs 1.55 nmol/ml, p=0.0001) and T4 (5.65 vs 8.19 µg/dl, p<0.0001) were significantly lower in ESS than euthyroid children, but there was no significant difference in TSH (2.44 vs 2.59 µU/ml, p=0.36). 25 (OH) D was significantly lower in ESS than euthyroid children (18.17 vs 41.82 ng/dl, p<0.0001). In ESS children the total T3 and T4 were positively and significantly correlated with circulating 25 (OH) D (r = 0.25; p = 0.03 and r = 0.55; p<0.0001), whereas TSH was not significantly correlated. The mean of total T3 (1 vs 1.01 vs 1.45 nmol/ml, p= 0.012) and T4 (4.99 vs 6.8 vs 7.44 µg/dl, p= 0.000) were significantly lower in vitamin D deficient ESS children. Conclusion: ESS with vitamin D deficient children has significantly low levels of thyroid hormones. Total T4 was positively correlated with vitamin D levels; hence lower serum total T4 levels with vitamin D deficiency were predictors to assess the severity and prognosis of ESS in acutely ill children. Key words: Euthyroid; Euthyroid sick syndrome (ESS); Thyroid stimulating hormone (TSH); Thyroxine (T4); Tri-iodothyronine (T3); 25(OH) vitamin D.
INTRODUCTION Malnutrition and illness influence every aspect of thyroid hormone economy, from the control of secretion to the delivery, and metabolism. This has led to the terminology known as "Sick Euthyroid Syndrome" or "Euthyroid Sick Syndrome (ESS)", occurs most commonly in acutely ill infants or children admitted to intensive care units (ICU), which is characterized by low serum tri-iodothyronine (T3), thyroxine (T4), normal serum thyroid stimulating hormone (TSH) and serum reverse T3 (rT3) levels may be low or elevated in ESS, without pre-existing hypothalamic pituitary or thyroid gland dysfunction.1, 2 Whether the hormone responses in ESS represent part of an adaptive response, which limits protein catabolism and lowers tissue energy requirement in systemic illness or is a maladaptive response inducing damage to tissues in hypothyroidism, remains unclear.3 Previous studies have shown that serum T3 and T4 levels are associated with the severity of the disease.1,4 The exact cause of changes in serum thyroid hormone and TSH observed in ESS is not completely understood. Many mechanisms are included: down regulated hypothalamic-pituitary-thyroid axis, impaired intracellular uptake of T4 and T3, decreased conversion of T4 to T3 by type 1 deiodinase (D1), increased T4 to rT3 by D3, reduced thyroid hormone-binding proteins, and diminished expression of nuclear thyroid hormone receptors.1 Vitamin D deficiency is a global health problem and one of the most common undiagnosed medical conditions in the world where over a billion people worldwide have some vitamin D deficiency or insufficiency.5, 6 Since both vitamin D and thyroid hormones act via steroid receptors, so any alteration in the level of vitamin D is likely to increase problems associated with hypothyroidism.7 Though a majority of the population in India lives in areas receiving ample sunlight throughout the year, vitamin D deficiency is very common in all the age groups and both the sexes across the country.8, 9 The role of vitamin D is explored as an anti-inflammatory, anti-proliferative factor and association with many clinical disorders.5 Vitamin D deficiency increases susceptibility to severe infections, and recent epidemiological studies have shown the association between hypovitaminosis D and respiratory infection among children, especially tuberculosis.10 National data on vitamin D deficiency in children are not yet available even in the most developed nations. Most of the available data abstracted from studies that primarily focused prevalence of vitamin D deficiency in Hashimoto’s thyroiditis on the adult population.10 No study has investigated the association between vitamin D deficiency and ESS in ICU children. Thus, the aims of this present study were to assess: (a) The prevalence of ESS and its relation to thyroid profile in acutely ill pediatric population. (b) Vitamin D status and its correlation to thyroid profile in children. (c) Prevalence of vitamin D deficiency and its association with ESS and euthyroid children.
MATERIALS AND METHODS The present case-control study was conducted on 120 children from one to five year age groups, over a period of one year. Out of 120 children, 50 healthy children were included as controls who visited the hospital for a routine general check-up. Seventy children were included as cases who admitted in ICU with acute illness. Children with clinical evidence of endocrine abnormality, especially thyroid and pituitary, rickets, other musculoskeletal disorders, any medication history that involved taking calcium or vitamin D supplements, and sunscreens, were excluded from the study by history, examination, and investigations. Under complete aseptic conditions, 4 ml of venous blood was withdrawn from an anticubital vein into the plain and EDTA vacutainers. From the plain vacutainer, serum was extracted to estimate the total T3, T4, TSH and 25(OH) D by Enzyme-Linked fluorescence assay (ELFA) method on Biomerieux instrument using commercially available Mini Vedas kits. From EDTA vacutainer, plasma was extracted to estimate the haemoglobin (Hb) using Sysmex XS- 800i cell counter. The protocol provided along with the kits was strictly followed during analysis. According to the age-specific reference ranges, children with TSH levels between 0.25-5 µIU/ml, total T3 levels between 1.04–2.66 nmol/l, and total T4 levels between 7.3–14.9 µg/dl categorized as euthyroid or controls. Children with total T3 and T4 levels lower than normal values and normal TSH levels categorized as Euthyroid sick syndrome (ESS). Until now, there is a controversy about the precise level of vitamin D and the level of vitamin D categories (i.e., deficient, sufficient or toxic). The United States Endocrine Society published a recent clinical practice guidelines redefining deficiency as a level below 20 ng/ml (50 nmol/l), insufficiency as a level between 21 and 30 ng/ml (52.5-72.5 nmol/l), sufficiency at a level above 30 ng/ml (>75 nmol/l), and toxicity at a level above 150 ng/ml (375 nmol/l).11,12 Statistical analysis Statistical analysis was carried out using Sofa Stats software (Open source statistics, analysis, and reporting software from Paton-Simpson and Associates Ltd.). Categorical variables were described by number and percent (n, %), whereas continuous variables were described by mean and standard deviation (mean, SD). The significance of the difference between two independent proportions was calculated using vassarstats software to compare categorical variables, while Student’s t-test and analysis of variance (ANOVA) used to compare continuous quantitative variables. An unpaired t-test used for “p” values and 95% CI (CI) were calculated from the mean, SD, number by using Graph Pad Prism version 7 software (commercial scientific 2D graphing and statistics software published by GraphPad Software, Inc., California). One way ANOVA by Dr. Daniel Soper used to calculate p-value between three different groups by Statistics calculator version 4.0. Pearson’s correlation coefficient (r) was performed using the Social Sciences statistics to explore the relationship between quantitative variables. A p-value of ≤ 0.05 was taken as statistically significant. OBSERVATIONS AND RESULTS The average age of 120 children enrolled in the study was 2.08 years. It was observed that out of the total 120 children, 69 (57.5%) were male and 51 (42.5%) were female. The overall male to female ratio was 1.35:1. Based on the thyroid profile, children were divided into Euthyroid and Euthyroid Sick Syndrome (ESS). Out of total study cases, there were 50 (33.33%) cases of Euthyroid, among these 26 (52%) were male and 24 (48%) were female. There were 70 (46.67%) cases of ESS, among these 43 (61.43) were male and 27 (38.57) were female. The prevalence of ESS in male was significantly more than female (p = 0.007) (Table 1). Table 1: Prevalence of male and female children among study cases
ESS: Euthyroid Sick Syndrome; * Significant According to their serum 25 (OH) D levels, the children were divided into three groups: Vitamin D Deficiency (<20ng/ml); Vitamin D Insufficiency (21-30ng/ml); Vitamin D Sufficiency (>30ng/ml). Out of the total 120 study cases, 54 (45%) were vitamin D deficient, 27 (22.5%) were vitamin D insufficient, 39 (32.5%) had sufficient vitamin D. The prevalence of vitamin D deficiency was more in male than female (61.1% vs 38.9%, p= 0.02) (Table 2).
Table 2: Prevalence of vitamin D status between male and female children.
* Significant The prevalence of vitamin D deficiency was significantly more in ESS than euthyroid children (88.9% vs 11.1%, p<0.0001), but there was no significant difference in vitamin D insufficiency between euthyroid and ESS children (48.15 vs 51.85%, p= 0.79). The prevalence of sufficient vitamin D was significantly more in euthyroid than ESS (79.49% vs 20.51%, p<0.0001) (Table 3). Table 3: Prevalence of vitamin D status among euthyroid and ESS children
ESS: Euthyroid Sick Syndrome; * Significant
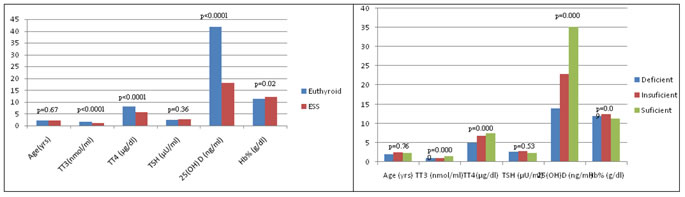
Table 4: Comparison of variables among euthyroid and ESS children
TT3: Total triiodothyronine; TT4: Total thyroxine; TSH: Thyroid stimulating hormone; Hb%: Haemoglobin; ESS: Euthyroid Sick Syndrome; * Significant. Table 5: Correlation of 25(OH) D with thyroid profile in children.
TT3: Total triiodothyronine; TT4: Total thyroxine; TSH: Thyroid stimulating hormone; ESS: Euthyroid Sick Syndrome; * Significant. r: correlation coefficient It was observed that in ESS children the total T3 and total T4 were positively and significantly correlated with circulating 25 (OH) D (r = 0.26; p = 0.03 and r = 0.55; p<0.0001), whereas TSH was not significantly correlated with 25 (OH) D. In euthyroid children thyroid profile were not significantly correlated with 25 (OH) D (Table 5).
Table 6: Comparison of variables with vitamin D status in total children.
TT3: Total triiodothyroxine; TT4: Total thyroxine; TSH: Thyroid stimulating hormone; Hb%: Hemoglobin; * Significant
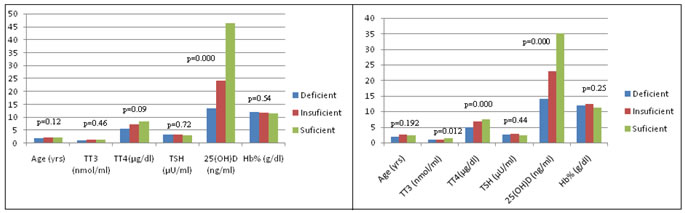
In euthyroid children, the mean of 25 (OH) D was 41.82 ng/ml. The mean of 25 (OH) D in vitamin D deficient, vitamin D insufficient and vitamin D sufficient groups were 13.4 vs 25.26 vs 53.8 ng/ml respectively. There was no significant difference in all variables between these three groups (Table 7, Fig 3).
Table 7: Comparison of variables with vitamin D status in euthyroid children.
TT3: Total triiodothyroxine; TT4: Total thyroxine; TSH: Thyroid stimulating hormone; Hb%: Hemoglobin; ESS: Euthyroid Sick Syndrome; * Significant
Table 8: Comparison of variables with vitamin D status in ESS children.
TT3: Total triiodothyroxine; TT4: Total thyroxine; TSH: Thyroid stimulating hormone; Hb%: Haemoglobin; ESS: Euthyroid Sick Syndrome; * Significant. In ESS children, the mean of total T3 (1 vs 1.01 vs 1.45 nmol/ml, p= 0.012) and total T4 (4.99 vs 6.8 vs 7.44 µg/dl, p= 0.000) were significantly lower in vitamin D deficient group than vitamin D insufficient and vitamin D sufficient groups, whereas remaining variables were insignificant between three groups (Table 8, Fig 4). Figure 1: Comparison of variables among euthyroid and ESS children Figure 2: Comparison of variables with vitamin D status in total children. Figure 3: Comparison of variables with vitamin D status in euthyroid Figure 4: Comparison of variables with vitamin D status in ESS children children There was no significant difference in the mean of age in euthyroid and ESS children (2.03 vs 2.13 yrs, p=0.67). Among the thyroid profile, the mean of total T3 (1.06 vs 1.55 nmol/ml, p= 0.0001) and total T4 (5.65 vs 8.19 µg/dl, p<0.0001) were significantly lower, but there was no significant difference in the mean of TSH (2.59 vs 2.44 µU/ml, p= 0.36) in ESS than euthyroid children. The mean of 25 (OH) D was significantly lower in ESS than euthyroid children (18.17 vs 41.82 ng/dl, p<0.0001). There was a significant increase of haemoglobin in ESS than euthyroid children (12.04 vs 11.42 g/dl, p=0.02) (Table 4, Fig 1). In 120 study cases of children, the mean of 25 (OH) D in vitamin D deficient, vitamin D insufficient and vitamin D sufficient groups were 13.6 vs 24.03 vs 46.32 ng/ml respectively. The mean of total T3 (1.09 vs 1.31 vs 1.54 nmol/ml, p= 0.000) and total T4 (5.6 vs 7.39 vs 8.52 µg/dl, p= 0.000) were significantly lower in vitamin D deficient group than vitamin D insufficient and vitamin D sufficient groups, whereas remaining variables were insignificant between three groups (Table 6, Fig 2).
DISCUSSION Thyroid hormones play a major role in children’s metabolism, growth, and pubertal maturation. Hypothyroidism is the most common disturbance of thyroid function in children. When there is no evidence of thyroid dysfunction, but with abnormal thyroid profile, interpreting the test results can be a challenge. These changes may mimic or mask the biochemical abnormalities of true thyroid disease. ESS is the most common biochemical abnormality of endocrine function as frequently as in intrinsic thyroid disease; is a typical feature of critically ill patients in intensive care units. Earlier studies have documented the prevalence of ESS from 45% to 84%.13 In our study, the prevalence of ESS was 46.67%, among these the prevalence of ESS in male was significantly more than female (p = 0.007). The magnitude of changes in serum T3 and T4 do not depend on the type of illness but on its severity. The presence of ESS is a predictor of poor prognosis of acute or chronic illnesses. Vitamin D deficiency is a global health problem.5 Serum 25 (OH) D is used to reflect vitamin D status because it is the major circulating precursor of active vitamin D and has a half-life, ranging from two to three weeks.14 Its level is used as a functional indicator or biomarker in monitoring vitamin D status, unlike the 1α, 25 (OH) 2 D (calcitriol) [10]. Moreover, low-level of serum 1, 25-(OH) 2 D may not observe until vitamin D deficiency is severe [5], hence 25 (OH) D level is used to assess vitamin D reserve. Vitamin D plays an important role, not only for bone health, but also in the immune system.15 In the United States, serum 25 (OH) D concentrations were measured for children aged 1–5 y in the two most recent cycles of the National Health and Nutrition Examination Survey (NHANES 2003–2004 and 2005–2006). Approximately 14% of children in this age group were reported to have 25 (OH) D concentrations <50 nmol/L. In contrast, a higher prevalence of low vitamin D status [25 (OH) D < 50 nmol/L] of nearly 20% was found in a nationally representative sample of children of the United Kingdom aged 1.5–4.5 y when surveyed throughout the year.16 In previous decades, vitamin D deficiency was considered virtually nonexistent in the Indian population, as India lies in the tropical area.17 However now a day various studies have revealed that 50-90% of the Indian population is deficient in vitamin D due to an inadequate dietary intake of calcium.18 Giovannuci et al. 2006 reported that vitamin D deficiency was seen in 59% of the subjects irrespective of the thyroid status.19 In our study, the prevalence of vitamin D deficiency was 45%, vitamin D insufficiency was 22.5%, and sufficient vitamin D was seen in 32.5% of total study children. In our study the prevalence of vitamin D deficiency was more in male than female children with p=0.02, which disagrees with the Amal Mohammed et al. 2013 study.20 McNally JD et al. 201721 reported that the worldwide prevalence of vitamin D deficiency was 54% and Madden K et al. 201222 reported 40% prevalence of vitamin D deficiency in critically ill children, whereas our study showed the highest prevalence of 88.9% vitamin D deficiency in ESS children admitted in ICU, while 51.85% vitamin D insufficient. Dutta D et al. 2013 reported 74% prevalence of vitamin D insufficiency in normal individuals, from eastern India23, whereas our study showed 79.49% of normal euthyroid children have significant sufficient vitamin D levels than ESS with p<0.0001, while 48.15% vitamin D insufficient. Our study in consistency with Zargar AH et al. 200413 that the mean of serum total T3 and total T4 levels showed a significant fall in ESS children at the onset of the sickness compared to euthyroid children with a p-value <0.0001, but there was no significant difference in the serum TSH levels. The pattern of hormone profile described above has been by now declared as a consistent feature of ESS. Thyroid functions in critically ill, related to the prognosis of ESS. In children and especially in infants no definite correlation of serum T3 and T4 levels and patient's prognosis hasn’t yet been found.4, 24-26 If children with a poor prognosis (low T3 T4 levels) could be identified earlier, and this may allow for closer observation and therapeutic intervention. This evidence to physicians is important, in order to avoid misdiagnosing the much more common primary thyroid dysfunctions and indicating treatments that are often not beneficial. Normal or low levels of TSH and decreased levels of thyroid hormones are characteristic of central hypothyroidism similar to ESS findings; this necessitates further investigation of hypothalamic-pituitary insufficiency. The mean of 25 (OH) D was significantly lower in ESS than euthyroid children (18.17 vs 41.82 ng/dl, p<0.0001, hence vitamin D deficiency was more common in ESS children admitted to ICU. Hb% was significantly more in ESS than euthyroid children with p=0.02 but within the normal reference range. The reason for the mild increase of Hb% in ESS was not known, needs further studies. The mean of Hb% and age were insignificant with vitamin D levels. There was no significance in mean age between euthyroid and ESS children. According to Kivity S et al. 2011 study, a positive correlation was observed between the 25 (OH) D and TSH levels in ESS children.27 In our study, we observed that TSH was not correlated with 25 (OH) D in ESS children, whereas the total T3 and T4 were positively and significantly correlated with circulating 25 (OH) D (r = 0.25; p = 0.03 and r = 0.55; p<0.0001). In euthyroid children, there was no correlation between thyroid profile and 25 (OH) D. Considering the vitamin D status in the overall study children the mean of total T3 (1.09 vs 1.31 vs 1.54 nmol/ml, p= 0.000) and T4 levels (5.6 vs 7.39 vs 8.52 µg/dl, p= 0.000) were significantly lower in vitamin D deficient group than vitamin D insufficient and vitamin D sufficient groups, whereas there was no significant difference in TSH, age, Hb%. Although the mean of total T3 was lower in vitamin D deficient children, but within the normal reference range. When considering only euthyroid children there was no significant difference in thyroid profile, age, and Hb% with vitamin D levels. When considering the vitamin D status in ESS children mean of total T3 (1 vs 1.01 vs 1.45 nmol/ml, p= 0.012) and T4 levels (4.99 vs 6.8 vs 7.44 µg/dl, p= 0.000) were significantly lower in vitamin D deficient group than vitamin D insufficient and vitamin D sufficient groups, whereas there was no significant difference in TSH, age, Hb%. It was observed that ESS with vitamin D deficient children has significant low levels of thyroid hormones. The fall in total T4 was more than the fall in total T3. Total T4 was more significantly and positively correlated with vitamin D levels with r = 0.55; p<0.0001 than total T3, hence serum total T4 levels with vitamin D deficiency were predictors to assess the severity and prognosis of ESS in acutely ill children. However, at this stage, we don't know whether vitamin D deficiency is just a marker of ill health, or whether it contributes to disease severity. The observed thyroid hormone abnormalities in ESS children do not indicate thyroid disease, but seem to represent a response to the underlying illness, as these invariably disappear with recovery from underlying illness and therefore do not require any treatment. The use of thyroid hormone therapy is still controversial in such illnesses; a few controlled trials have shown conflicting results for treatment with T3. Deficiency of vitamin D can lead to Grave’s disease and various other autoimmune thyroid disorders [9], hence the ESS children with vitamin D deficiency should be a monitor for thyroid function tests without treatment; this would avoid any of the risks of thyroid hormone treatment noted above, but vitamin D therapy is necessary when vitamin D levels are in the deficient range even if asymptomatic.28 The need for a national food fortification program for vitamin D has been highlighted in an earlier review.29 Fortification may help in preventing vitamin D deficiency and such public health interventions need serious consideration in the Indian context. One of the limitations of this study is; Hypothalamic Pituitary Thyroid axis function tests and serum rT3 were not investigated.
CONCLUSION Prevalence of ESS and vitamin D deficiency were higher in acutely ill children admitted in ICU. The low serum thyroid hormones and normal TSH levels were observed and declared as a consistent feature of ESS; is a typical feature of acutely ill children admitted in ICU. Serum total T4 levels with vitamin D deficiency were predictors to assess the severity and prognosis of ESS in acutely ill children. If children with a poor prognosis could be identified in earlier stages, it allows for closer observation and therapeutic intervention. Given the high rate of vitamin D deficiency in acutely ill children and the essential role of vitamin D in healthy bone development, we recommend screening acutely ill children for thyroid abnormalities and vitamin D deficiency and identifying effective repletion strategies.
ACKNOWLEDGMENT I would like to thank professor and HOD of Biochemistry and Pediatric departments, Government general Hospital, Mahabubnagar and the staff for their cooperation during the collection of blood samples.
REFERENCES
|
|||||||||||||||||||||||||||||||||||||||||||||||||||||||||||||||||||||||||||||||||||||||||||||||||||||||||||||||||||||||||||||||||||||||||||||||||||||||||||||||||||||||||||||||||||||||||||||||||||||||||||||||||||||||||||||||||||||||||||||||
 This work is licensed under a Creative Commons Attribution-NonCommercial 4.0 International License.