 Home
HomeOfficial Journals By StatPerson Publication
|
Table of Content - Volume 8 Issue 2 - November 2018
Pavani Kiranmai Thandu1, Suresh Babu Ganji2*, Tagore Ravirala3
1Assistant Professor of Biochemistry, American International institute of medical Sciences, Bedwas, Udaipur, Rajasthan, INDIA. 2Associate Professor, Department. of Biochemistry, MNJIO and RCC, Osmania Medical College, Hyderabad, Telangana, INDIA. 3Professor, Department of Biochemistry, SMC, Vijayawada, Andhra Pradesh, INDIA. Email: sushwasa@gmail.com
Abstract Objective: To study four biomarkers from distinct biological pathways that lead to hypertension, namely high sensitivity C reactive protein (hs CRP), fibrinogen, urinary albumin Creatinine ratio(UACR) and superoxide dismutase(SOD). Methods and Results: This was a retrospective study for a period of 3 months of 100 new hypertensive subjects of 30 to 45 age were compared to 50 age matched controls at a tertiary care hospital. After Univariate analysis of logistic regression, age and gender wise, male beyond 36 years shows a high risk for hypertension; hs CRP rise (odds ratio [OR]=23.91,sensitivity 75%,specificity 100%; p=0.000) was identified as the best diagnostic biomarker with a 23.9 folds risk of hypertension ,fibrinogen (OR=11.93 sen 52%,sp 98%; p=0.000), UACR (OR=11.93,sen 50%,sp 94%;p=0.000) and SOD (OR=2.44 sen 21%,sp 98%;p=0.005) in the order were significantly associated with development of hypertension. The highest discriminative value for diagnosis of hypertension was observed with raising levels of hs CRP(area under receiver operating characteristic curve [AUC]= 0.863), fibrinogen (AUC=0.832) and UACR (AUC=0.888). SOD levels were of lower significance (AUC=0.640) as compared to controls(p=0.014) and the enzyme activity was actually plummeted in severe hypertension, making this as a weak biomarker for the disease. ROC curve analysis gives a best cutoff levels for the diagnosis of hypertension as hs CRP >1.35mg/L; fibrinogen 445mg/dL; UACR >34.35 µg/mg Cr; and SOD >144.25 U/g protein. Multiple comparisons by post HOC tests for the 3 groups (stage1 and2 hypertension subjects and controls) reveal that hs CRP and UACR values rose significantly from normal to disease but not further whereas for fibrinogen, the levels further increased with raise in blood pressure. SOD was of lower significance when compared to the other 3 biomarkers in this study. Conclusion: Biomarkers of different pathophysiology mechanisms of development of hypertension, which are easily available for lab testing, can be used to predict ‘on track’ hypertensives for a routine health screen along with monitoring of blood pressure. Key Word: Hypertension, Biomarkers, High sensitivity CRP, Superoxide Dismutase
INTRODUCTION Hypertension is a key modifiable risk factor for cardiovascular morbidity and mortality. There has been a growing emphasis in practice on the importance of preventing hypertension to reduce the public health burden of cardiovascular disease.1 The importance of hypertension lies in the fact that it doubles the risk cardio vascular diseases forms one of the risk factors for coronary heart disease (CHD), ischemic and hemorrhagic stroke, congestive heart failure (CHF), atherosclerosis, renal failure, and peripheral vascular disease. 2 Therefore, it is critical to understand the most common mechanisms underlying the development of hypertension, as well as to formulate screening strategies that can reliably identify individuals most likely to develop hypertension. The biomarkers representing key biological pathways implicated in the pathogenesis of hypertension may prove to be helpful to screen the “on track” hypertensives as well as the new cases if in doubt. Data concerning various pathophysiologies derive primarily from cross-sectional studies, although several longitudinal studies have demonstrated that biomarkers representative of key biological pathways. 3,4,5,6,7 The biomarkers of higher values of which were most strongly associated with risk of developing hypertension are hs-CRP (inflammation), fibrinogen (increased plasma viscosity), Superoxide dismutase (SOD) (scavenger of Superoxide free radicals) and Urinary Albumin Creatinine Ratio (glomerular endothelial function).1,5 With this background we investigated these 4 biomarkers from pathways implicated in the pathogenesis of hypertension in the recently diagnosed hypertensives. The biomarkers were selected on the basis of biological plausibility, evidence from previous clinical studies. 2, 3, 8, 9, 10, 11, 12, 13 The seventh report of the Joint National Committee on Prevention, Detection, Evaluation, and Treatment of High Blood Pressure considers individuals with systolic blood pressure ≥ 120 mm Hg or diastolic blood pressure ≥ 80 mm Hg at risk of progressing to overt hypertension and in need of close follow up.14 Very few studies globally and in our country were done to prove the role of multiple biomarkers in and on the hypertension diseases per se, the present study is the done to examine the use of these biomarkers to predict the development of hypertension by proving their increase in plasma levels as the new cases are diagnosed. 15
MATERIALS AND METHODS We undertook this retrospective study with Institutional board approval in the year 2009 and were conducted in the OPD of general medicine and Clinical Laboratory of Department of Biochemistry, Osmania General Hospital, Hyderabad in Telangana, India. Subjects: The total of 100 (males 50 and females 50) newly diagnosed hypertensives and not yet regularly using any form of anti hypertensive treatment and aged between 30 – 45 yrs approaching the General Medicine, outpatient Block, were screened for a period of 3 months to be included in the study. Fifty controls (26 male, 24 female) that were clinically non hypertensive (<140/90 mmHg) of 30-45 years of age were also included in the study. Informed consent was taken from all of them. The subjects were grouped as A and B depending upon the staging of Blood pressure and Controls were labeled as group C;14
Exclusion Criteria: History of Diabetes Mellitus, Liver Disorders, Renal abnormalities, abnormal ECG and or use of any antioxidant, vitamin supplementations and pregnancy or urinary tract infection. Overweight subjects based on BMI were also excluded. The average of 2 systolic and diastolic blood pressure measurements obtained in both sitting and supine positions. Basic investigations like FBG, Blood Urea, S.Creatinine, and LFT and ECG were done routinely at OPD Laboratory. 3ml venous whole blood in 5 mg% EDTA collection bottle for plasma (for Fibrinogen), 5 ml venous blood in plain bottle and allowed to clot to separate serum (for SOD and Total Proteins , CRP) and 10ml of spot urine sample (for Microalbumin/Creatinine ratio) were collected and samples analyzed on Olympus AU 2700 automated analyzers. METHODOLOGY The estimation of hs-crp is by immunoturbidimetry method16; fibrinogen by manual fibrin clot (Image1) and biuret method17,18; Microalbumin in urine by immunoturbidimetry method19; Creatinine (for obtaining Urine Albumin/Creatinine ratio) in urine by jaffe’s reaction20,19; Superoxide dismutase (SOD) activity by manual/ spectrophotometric method by inhibition of auto oxidation of adrenaline; total protein (for SOD expression) biuret method.18,21 {the terminology hs CRP and Microalbumin denotes the assay names to estimate very low levels of CRP and albumin, respectively}. Image 1: Preparation of plasma fibrin Clot The results were expressed as Mean ± SD. The results data was statistically analyzed using SPSS-15 and MS-EXCEL in WINDOWS XP. RESULTS Univariate Analysis of Variance was performed, P values < 0.05 were considered statistically significant and P < 0.001 is taken as highly significant. Receiver Operating Characteristic (ROC) curves and areas under the ROC curves (AUC, also known as c-statistic) with 95% confidence intervals were calculated for the four parameters for evaluating the optimum cut-off points. The utility of each parameter for identifying the hypertension was evaluated by calculating the sensitivity, specificity and diagnostic efficiency by calculating the Odds Ratios by Logistic regression. POST HOC TESTS done for Multiple Comparisons between the cases and controls were made for 95% Confidence Intervals.
Table 1: descriptive statistics of the patients and controls {stage-1(a) stage-2(b) and controls (c)}
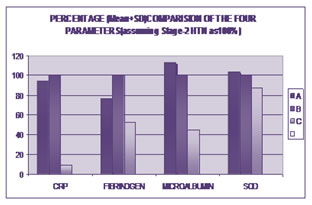
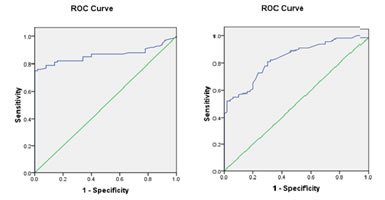
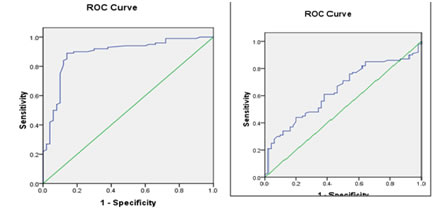
Figure 1: Diagrammatic representation of Descriptive statistics Figure 2 A: Roc Curves of Hs-Crp And Fibrinogen Figure 2 B: Roc Curve of Microalbumin and Sod Table 2: biomarkers with significant discriminative value and optimal cut-off points of biomarker levels for hypertension designated on the basis of roc curves
Table 3 A: Multiple Comparison Stage-1(A) Vs Stage-2(B) and Controls(C)
Table 3 B: Multiple Comparison Stage-2(B) Vs Stage-1(A) and Controls
DISCUSSION We have attempted to identify biomarkers with the strongest association in early hypertension and to evaluate the performance characteristics of each biomarker towards predicting the incidence of hypertension. The cases and controls were almost equally distributed between sex and among all the age groups (30–45 years). Hs-CRP, a biomarker of inflammation, showed a significant increase in cases (Table 1 and fig 1) i.e. stage I and stage II hypertensive (mean ± SD: 4.87±2.93 and 4.64±3.62 respectively) when compared to controls (0.44 ± 0.29) with P values <0.001. Similar results were observed by Thomas J. et al 1. The ROC curve (Fig 2a) for CRP shows the best cutoff value as 1.35 mg/dL, with AUC value 0.863 which gives the sensitivity 75% and the specificity as 100%. Post HOC tests for multiple comparisons (Table3aand3b) revealed there was no difference for hs CRP levels among both stages of hypertension but there was a significant difference between the diseased and normal. CRP promotes vasoconstriction, indirectly by decreasing the production of the nitric oxide by the vascular endothelial cells. It also has pro-atherosclerotic properties by up regulating the RAAS pathway, thus contributing to the pathogenesis of Hypertension. Higher levels of CRP also play an important role in the induction of PAI-1, a marker of impaired fibrinolysis and atherothrombosis, which possibly mediates the association between CRP and the development of hypertension.22, 23 Plasma fibrinogen values (Table 1 and fig 1) in Stage I and Stage II hypertensives (mean ± SD: 403.01 ± 130.41 and 525.54 ± 170.8 respectively) were significantly higher than that in Controls (292.22 ± 73.7) with P value <0.001, the total difference in-between the three groups was significant. Several plausible mechanisms could explain an observed association between elevated fibrinogen levels and hypertension, including the relation of fibrinogen to increased viscosity and peripheral vascular resistance hyperinsulinemia and insulin resistance, and markers of inflammation. 24, 25, 26, 27, 13, 24,6 The ROC curve (Fig 2a) for Fibrinogen shows the best cutoff value as 445 mg/dL, with AUC 0.832 which gives the sensitivity 52% and the specificity as 98 %. Multi comparisons among each of the three groups were significant for the elevations of plasma fibrinogen as shown in Table 3. Urinary Microalbumin levels (Table 1 and fig 1) in stage I stage II hypertensives (Mean + SD: 39.75 ± 22.45 and 37.94 ± 17.14 respectively) were significantly higher than in controls (13.26 ± 11.62) with P values <0.001. But the difference between stage I and stage II hypertensives is not significant (Table 3a and 3b) similar with hs CRP. The ROC curve (Fig 2b) for Microalbumin shows the best cutoff value 34.35 µg/mg, AUC 0.888 which gives the sensitivity 50% and the specificity as 94 %. This finding extends the results of a previous study as well as cross-sectional studies that have reported an association between urinary albumin excretion and blood pressure.28,29,30 This data underscore the potential role of endothelial dysfunction in the kidneys in the pathogenesis of hypertension. It is possible that urinary albumin excretion reflects exposure of the glomeruli and kidneys to previous elevations in blood pressure rather than playing a direct, etiologic role. 31, 32 According to the cut-off values from the ROC analyses; CRP, Fibrinogen and UACR were the parameters that appeared significantly in that order in the hypertensive patients, when compared to the healthy controls (P=0.001.) Superoxide dismutase (SOD) levels (Table1 and fig 1) are increased though not much (P=0.014) in both stages compared to controls (117.59±32.42 and 105.94±40.41 Vs 98.19±28.76). This finding is contrary to the previous studies where they demonstrated a decrease in the enzyme activity in hypertension, and those studies were done on the established or chronic cases of hypertension.33,34 SOD levels showed significance when stage -1 compared to control values (P =0.004, Table 3aand3b) but not with stage 2. The raised SOD in the First stage (A) can be attributed to early response to oxidative stress. Interestingly SOD levels in stage II were found to be lower than that of stage I, might implicate the ongoing severity of oxidative stress to establish so that the enzyme activity start downhill. Tohru Fukai et al found that extra cellular ecSOD expression is substantially regulated in atherosclerosis, hypertension and importantly by NO.35 Hence, the SOD activity increase might be an important adaptive mechanism that caters increased scavenging of superoxide anion, in hypertension, in which this anion production might increase. And as the disease progresses, i.e., towards severe hypertension, the superoxide anion production supersedes the scavenging enzyme activity, further establishing the oxidative stress. Analysis of logistic regression to identify the best diagnostic biomarker in hypertensive patients showed that CRP cut-off value were associated with a 23.9-fold higher significant risk of hypertension (Odds Ratio: 23.917; P=0.001) shown in Table 2. Then, Fibrinogen and Microalbumin cut-off values were associated with a11.9-fold higher risk of hypertension (Odds Ratio: 11.93; P=0.001 for both). Taking the age in to consideration, though age alone does not correspond to the severity of hypertension (P = 0.07), Some significance was observed when age and sex were both considered, showed an increase in the severity of the disease (P =0.006) With male sex and advancing age beyond 36 yrs may be considered a high risk to land up in hypertension (Table 1). Framingham Heart study reported the lifetime risk of hypertension to be approximately 90% for men and women who were non hypertensive at 55or 65 years old and survived to age 80-85. 15 Multiple comparisons by Post HOC Tests showed that there is a significant difference in the levels and increased levels of all four parameters observed when hypertensives are compared to controls. And a significant association of raised in the levels was seen with Fibrinogen only, where as for CRP, UACR, though raised more than normal, but of not significant variations observed according to the severity or stage of hypertension (Table 3a, 3b).
LIMITATIONS OF THE STUDY Our study involved a relatively small number of patients, with only four biomarkers and was retrospective. We did not evaluate the combined associations and ‘Multimarker’ model with mutual analysis. The biomarkers especially CRP as well as Fibrinogen levels in early diabetes may also show raise, or could there had been non obese metabolic X syndrome, could have been properly ruled out by conducting GTT, instead of FBS for ruling out insulin resistance. 36
CONCLUSION In summary, our study analysis suggests that inflammation (CRP), reduced Fibrinolytic potential as well as inflammation (FIBRINOGEN), and endothelial dysfunction (UACR) and Oxidative stress (SOD) are implicated in the pathogenesis and development of hypertension risk in non-hypertensive individuals. The hs-CRP has been proved the best among the parameters as the predictive test with a high sensitivity and specificity followed by Fibrinogen and Microalbumin. In evaluation of hypertensives, or for screening purpose, these biomarkers (except SOD) can be estimated on a routine basis, as they are also cost effective and readily available commercially. This study data support the premise, that abnormalities in multiple pathways antedate the onset of overt hypertension. Nonetheless, the predictive value of existing biomarkers for assessing future hypertension risk is modest.
REFERENCES
|
||||||||||||||||||||||||||||||||||||||||||||||||||||||||||||||||||||||||||||||||||||||||||||||||||||||||||||||||||||||||||||||||||||||||||||||||||||||||||||||||||||||||||||||||||||||||||||||||||||||||||||||||||||||||||||||||||||||||||||||||||||||||||||||||||||||||||||||||||||||||||||||||||||||||||||||

 This work is licensed under a Creative Commons Attribution-NonCommercial 4.0 International License.