 Home
Home
|
Table of Content - Volume 1 Issue 2 - February 2016
A study of correlation of thyroid dysfunction on lipid abnormalities in post menopausal women
Shigil Mathew Varghese*, Arun Kumar S**, Babu R**, Sakthivel V***, Nikil Sam Varughese*
Department of General Medicine, Vinayaka Missions Medical College and Hospital, Karaikal, INDIA.
Abstract Objective: 1) To study the effects of thyroid dysfunction on lipid profile. 2) To study the prevalence of thyroid dysfunction in postmenopausal women Methods: Type of study: Prospective Randomized case control study, Sample size: 100 Postmenopausal women who will be attending the outpatient and inpatient of Medicine department in Vinayaka Missions Medical College and Hospital, Karaikal. Inclusion Criteria: Postmenopausal women attending outpatient and inpatient of Medicine Department. Exclusion Criteria: Known cases of diabetes mellitus, Known cases of Thyroid dysfunction, Known cases of hypertension, Known cases of Chronic kidney disease, Patients on Hormone replacement therapy, Diagnosed cases of Ovarian and uterine malignancy, Patients on drugs like iodide, amiodarone, salicylates, propranolol, octreotide, phenytoin, lithium, glucocorticoid, amphetamine, aminoglutethemide, somatostatins. statistically analysed. Conclusion: It was observed that postmenopausal women with thyroid dysfunction, especially subclinical hypothyroidism, had lipid abnormalities. Lipid abnormalities seen in subclinical hypothyroidism patients are mainly in the form of significant elevation of total cholesterol and HDL. According to this study, thyroid dysfunction is directly related to total cholesterol and HDL changes (p< 0.01).Changes have also been noted with thyroid dysfunction and Non HDL Cholesterol mainly LDL and VLDL but, they were not statistically significant. Therefore, in post menopausal women with thyroid dysfunction evaluation of lipid profile should be made mandatory to avoid the risk of Coronary artery disease, Cerebrovascular accident. Key Words: thyroid dysfunction, lipid abnormalities.
INTRODUCTION According to American Association of Clinical Endocrinologists, it has been found that millions of women with menopausal like symptom may in fact be suffering from thyroid disease. They predominantly have subclinical thyroid dysfunctions, Hypothyroidism being more than Hyperthyroidism4,6,7. In a developing country like India, thyroid profile is not routinely done in postmenopausal women. Menopausal symptoms may be misinterpreted and thyroid dysfunctions go undetected, which in turn lead to health hazards like dyslipidemia, increased risk of hypertension and ischemic heart disease. Therefore this study is necessary to stress the importance of regular screening for timely detection and prevention of further complications, associated with thyroid dysfunctions in postmenopausal women9,10. The study intends to investigate the relationship between the menopausal status and related variation of thyroid hormones with plasma lipid concentrations. Menopause Menopause is an unspoken, unattended, reality of life, the cause of which is still undeciphered completely by man. Menopause, also known as the climacteric, is the time in most women's lives when menstrual periods stop permanently, and they are no longer able to have children.11, 12 Menopause typically occurs between 45 and 55 years of age.11 Medical professionals often define menopause as having occurred when a woman has not had any vaginal bleeding for a year.13 It may also be defined by a decrease in hormone production by the ovaries.4
MATERIAL AND METHODS Project was submitted to ethical committee, got approval from the ethical committee. Test and control population were recruited after obtaining all necessary consent in their local regional language. Postmenopausal women who attended the outpatient and inpatient of Medicine department in Vinayaka Missions Medical College and Hospital, Karaikal Method of Collection of Data and Method of Study The purpose of the study was explained to the patient and informed consent obtained. Patients were recruited as per inclusion- exclusion criteria. Relevant history including symptoms and signs at presentation, past medical history, drug history and examination findings noted. Data was collected using a proforma meeting the objectives of the study.
Inclusion Criteria
Exclusion Criteria
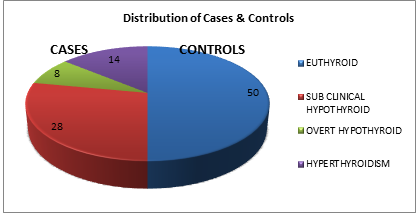
RESULTS AND DISCUSSION DEMOGRAPHIC DATA In this study, 100 post menopausal women who fulfilled the inclusion-exclusion criteria were selected. Out of which, 50 were chosen as study/test group and 50 as control group. Subjects in control group were euthyroid, whereas those in test group had thyroid dysfunction. Thyroid profile and fasting lipid profile was done and their results compared to assess if thyroid dysfunction caused alteration in their lipid profile. Out of 50 test subjects, 28 were found to have subclinical hypothyroidism, 8 overt hypothyroidism and 14 with hyperthyroidism. Test group constituted subjects between the age 42 to 81 years. The majority of test and control subjects were in the age group of 42-50 years (50%), followed by persons in the age group 51-60 years (30%).
Table 1: Distribution of age groups of test and controls
Figure 1: Showing the distribution of age groups of test and controls
Distribution of Cases and Controls Out 100 subjects, 50 subjects were chosen as test group and 50 as controls. Subjects in control group were euthyroid whereas those in test group had thyroid dysfunction, predominantly hypothyroidism. Among test subjects, 28 had subclinical hypothyroidism, 8 overt hypothyroidism and 14 had hyperthyroidism.
Table 2: Distribution of Cases And Controls
Figure 2: Distribution of cases and controls
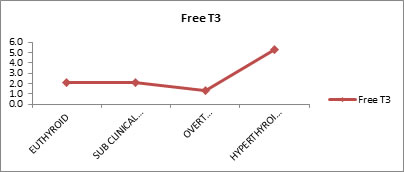
Free T3 Levels in Each Group Free T3 levels of subjects in test and control group was evaluated. It was observed that mean free T3 values for euthyroid subjects were 2.1, sub-clinical hypothyroid 2.1, overt hypothyroid 1.4 and for hyperthyroid subjects 5.3
Table 3: Free T3 levels in each of the groups
Table 3 shows the mean Free T3 values for Euthyroid, sub-clinical hypothyroid, overt hypothyroid and hyperthyroidism were (2.1), (2.1), (1.4) and (5.3) respectively. There was good statistically significant difference between the groups (P VALUE <0.01).
Figure 3: Free t3 levels in each of the groups
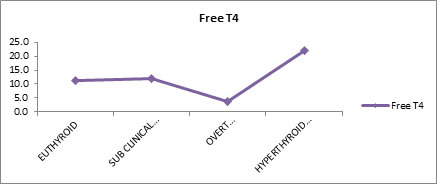
Free T4 Levels in Each Group Free T4 levels of test and control subjects were evaluated. Results showed that mean free T4 values for euthyroid, sub-clinical hypothyroid, overt hypothyroid and hyperthyroidism were (11.3), (11.9), (3.7) and (22.1) respectively.
Table 4: Free T4 levels in each of the groups
Table 4 shows the mean Free T4 values for Euthyroid (11.3), sub-clinical hypothyroid (11.9), overt hypothyroid (3.7) and hyperthyroidism (22.1). There is good statistically significant difference between the groups. (P VALUE <0.01)
Figure 4: Free t4 levels in each of the groups
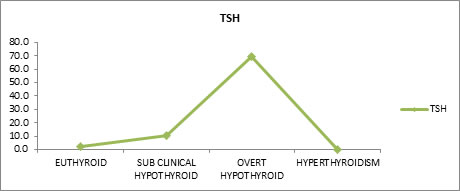
Tsh Levels in Each Group Free TSH levels of test and control subjects were evaluated. Mean free TSH values for euthyroid, sub-clinical hypothyroid, overt hypothyroid and hyperthyroidism were found to be 2.2, 10.3, 69.3 and 0.2 respectively.
Table 5: TSH levels in each of the group
P value <0.01
Table 5 shows the mean TSH values for Euthyroid (2.2), sub-clinical hypothyroid (10.3), overt hypothyroid (69.3) and hyperthyroidism (0.2). There is good statistically significant difference between the groups.
Figure 5: TSH levels in each group
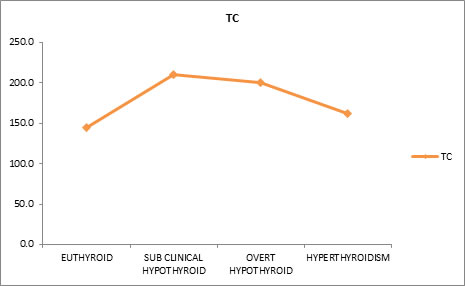
Effect of Thyroid Dysfunction on Levels of Total Cholesterol Effect of thyroid dysfunction on total cholesterol levels were evaluated. Mean total cholesterol (TC) values were found to be 145.3mg/dl for euthyroid subjects, 209.7 mg/dl for sub-clinical hypothyroid, 200 mg/dl for overt hypothyroid and 161.9 mg/dl for hyperthyroid subjects. Results indicated that free T3 and total cholesterol (TC) have negative correlation. This means that as free T3 decreases, total cholesterol increases and vice versa. Similarly free T4 and total cholesterol also have negative correlation. Whereas TSH and total cholesterol have positive correlation, that is, as total cholesterol increases the TSH also increases and vice versa.
Table 6: Effect of thyroid dysfunction on levels of total cholesterol
P VALUE <0.01
Table 6 shows the mean Total Cholesterol (TC) values for Euthyroid (145.3mg/dl), sub-clinical hypothyroid (209.7 mg/dl), overt hypothyroid (200 mg/dl) and hyperthyroid (161.9 mg/dl). There is good statistically significant difference between the groups.
Figure 6: Effect of thyroid dysfunction on levels of total cholesterol
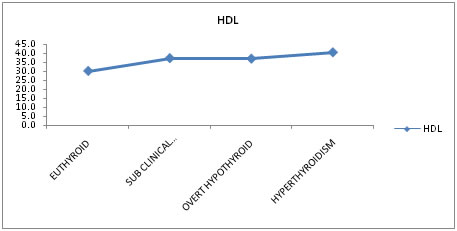
Effect of Thyroid Dysfunction on High Density Lipoprotein Effect of thyroid dysfunction on High Density Lipoprotein levels were evaluated. Mean High Density Lipoprotein values were found to be 30mg/dl for euthyroid subjects, 37.1 mg/dl for sub-clinical hypothyroid, 36.8 mg/dl for overt hypothyroid and 40.4mg/dl for hyperthyroid subjects. Results indicated that free T3 and high density lipoprotein (HDL) have positive correlation. This means as high density lipoprotein increases, free T3 also increases and vice versa. Similarly free T4 and HDL and TSH and HDL have positive correlation.
Table 7: Effect of thyroid dysfunction on levels of high density lipoprotein
P VALUE <0.01
Table 7 shows the mean High Density Lipoprotein (HDL) values for Euthyroid (30 mg/dl), sub-clinical hypothyroid (37.1 mg/dl), overt hypothyroid (36.8 mg/dl) and hyperthyroidism (40.4 mg/dl). There is good statistically significant difference between the groups.
Table 7.1: Effect of thyroid dysfunction on levels of high density lipoprotein
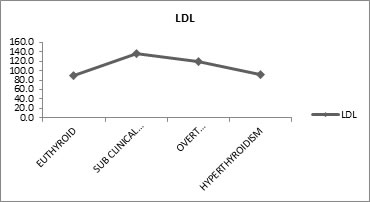
Table 7.1 shows, Free T3 and High Density Lipoprotein (HDL) have positive correlation (means as the HDL Increases the Free T3 also Increases and Vice Versa), similarly Free T4 and HDL, TSH and HDL have positive correlation. Free T4 and TSH are not statistically significant but Free T3 Vs HDL has high statistical significance. Effect of Thyroid Dysfunction on Levels Of Low Density Lipoprotein Effect of thyroid dysfunction on low density lipoprotein levels was evaluated. Mean low density lipoprotein (LDL) values were 88.8mg/dl for euthyroid, 137 mg/dl for sub-clinical hypothyroid, 119.8 mg/dl for overt hypothyroid and 92.4 mg/dl for hyperthyroid subjects. Free T3 and low density lipoprotein (LDL) have negative correlation which means as the LDL increases the free T3 decreases and vice versa. Similarly free T4 and LDL also have negative correlation. Whereas TSH and LDL have positive correlation, that is, as low density lipoprotein increases the TSH also increases and vice versa.
Table 8: Effect of thyroid dysfunction on levels of low density lipoprotein
P VALUE <0.01
Table 8 shows the mean Low Density Lipoprotein (LDL) values for Euthyroid (88.8mg/dl), sub-clinical hypothyroid (137 mg/dl), overt hypothyroid (119.8 mg/dl) and hyperthyroidism (92.4 mg/dl). There is good statistically significant difference between the groups.
Figure 8: Effect of thyroid dysfunction on levels of low density lipoprotein
Table 8: Effect of thyroid dysfunction on levels of low density lipoprotein
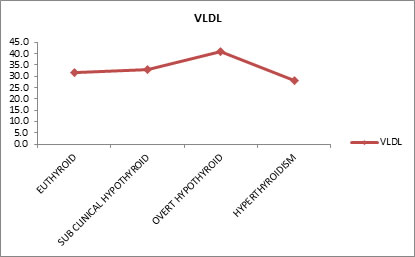
Table 8 shows, Free T3 and Low Density Lipoprotein (LDL) have negative correlation (means as the LDL Increases the Free T3 Decreases and Vice Versa), similarly Free T4 and LDL have negative correlation whereas TSH and LDL have positive correlation (means as the LDL Increases the TSH also Increases and Vice Versa). All the three parameters Free T3, T4, TSH Vs LDL are not statistically significant. Effect of Thyroid Dysfunction on Levels of Very Low Density Lipoprotein Effect of thyroid dysfunction on very low density lipoprotein levels were evaluated. Mean very low density lipoprotein (VLDL) values for euthyroid subjects were 31.9 mg/dl, sub-clinical hypothyroid 32.8 mg/dl, overt hypothyroid 41 mg/dl and hyperthyroid subjects were 28.2 mg/dl. Free T3 and very low density lipoprotein (VLDL) have negative correlation. It means as very low density lipoprotein increases the free T3 decreases and vice versa. Similarly free T4 and very low density lipoprotein have negative correlation. Whereas TSH and VLDL have positive correlation, that is, means as the VLDL Increases the TSH also increases and vice versa.
Table 9: Effect of thyroid dysfunction on levels of very low density lipoprotein
P VALUE >0.05
Table 9 shows the mean Very Low Density Lipoprotein (VLDL) values for Euthyroid (31.9 mg/dl), sub-clinical hypothyroid (32.8 mg/dl), overt hypothyroid (41 mg/dl) and hyperthyroidism (28.2 mg/dl). There is no statistically significant difference between the groups.
Figure 9: Effect of thyroid dysfunction on levels of very low density lipoprotein
Table 9: Effect of thyroid dysfunction on levels of very low density lipoprotein
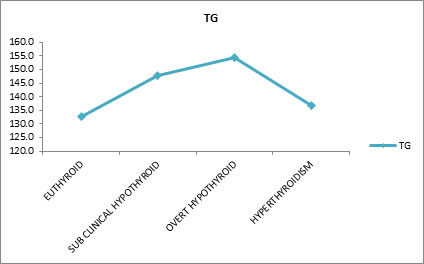
Table 9 shows, Free T3 and Very Low Density Lipoprotein (VLDL) have negative correlation (means as the VLDL Increases the Free T3 Decreases and Vice Versa), similarly Free T4 and VLDL have negative correlation whereas TSH and VLDL have positive correlation (means as the VLDL Increases the TSH also Increases and Vice Versa). All the three parameters Free T3, T4, TSH Vs VLDL are not statistically significant. Effect of Thyroid Dysfunction on Levels Of Triglyceride Effect of thyroid dysfunction on triglyceride levels were evaluated. Mean triglyceride (TG) values for euthyroid subjects were132.8 mg/dl, sub-clinical hypothyroid 147.7 mg/dl, overt hypothyroid 154.4 mg/dl and hyperthyroid subjects 136.6 mg/dl. Results show that free T3 and triglyceride (TG) have negative correlation. It means as triglyceride increases free T3 decreases and vice versa. Similarly free T4 and triglyceride also have negative correlation. Whereas TSH and triglyceride have positive correlation which means, as triglyceride increases the TSH also increases and vice versa
Table 10: Effect of thyroid dysfunction on levels of triglyceride
P VALUE >0.05
Table 10 shows the mean Triglyceride (TG) values for Euthyroid (132.8 mg/dl), sub-clinical hypothyroid (147.7 mg/dl), overt hypothyroid (154.4 mg/dl) and hyperthyroidism (136.6 mg/dl). There is no statistically significant difference between the groups.
Figure 10: Effect of thyroid dysfunction on levels of triglyceride
Table 10: Effect of thyroid dysfunction on levels of triglyceride
Table 10 shows, Free T3 and Triglyceride (TG) have negative correlation (means as the TG Increases the Free T3 Decreases and Vice Versa), similarly Free T4 and TG have negative correlation whereas TSH and TG have positive correlation (means as the TG Increases the TSH also Increases and Vice Versa). All the three parameters Free T3, T4, TSH Vs TG are not statistically significant.
REFERENCES
Policy for Articles with Open Access
|
|
|||||||||||||||||||||||||||||||||||||||||||||||||||||||||||||||||||||||||||||||||||||||||||||||||||||||||||||||||||||||||||||||||||||||||||||||||||||||||||||||||||||||||||||||||||||||||||||||||||||||||||||||||||||||||||||||||||||||||||||||||||||||||||||||||||||||||||||||||||||||||||||||||||||||||||||||||||||||||||||||||||||||||||||||||||||||||||||||||||||||||||||||||||||||||||||||||||||||||||||||||||||||||||||||

 This work is licensed under a Creative Commons Attribution-NonCommercial 4.0 International License.