 Home
Home
|
Table of Content - Volume 1 Issue 2 - February 2016
A study of correlation between lipid peroxide and HbA1C in the diabetic patients
M Natraj1*, S Sumathi2
1Sr. Assistant Professor, 2Associate Professor, Department of Biochemistry, Government Tiruvarur Medical College, Tiruvarur-610004, Tamil Nadu, INDIA. Email: nsramachandren@gmail.com
Abstract Aims and Objectives: To study Correlation between Lipid peroxide and HbA1C in the Diabetic Patients. Methodology: Participants of the study group were selected from the outpatients population of Department of Diabetology, Thanjavur Medical College, Thanjavur. 100 patients were selected for this study. Out of which 50 patients belong to NIDDM and 50 to IDDM group. 50 persons served as healthy control. Un-paired t-test was used for statistical analysis. Result: Overall the Values of Good control (HbAIC <7) Mean ± S.D and Poor control (HbAIC >7) Mean ± S.D were 4.14 ± 0.1 and 4.54±0.17 in IDDM and 4.37 ±0.08 and 4.92±0.33 in NIDDM and in Total DM Cases were 4.26 ±0.15 and 4.73±0.32 i.e. Significantly less in IDDM ( P<0.0001).Average Lipid values for cases With good control (HbAIC < 7) Mean + S.D. were Significantly less and HDL high than With poor control (HbAIC >7) Mean + S.D. (P<0.0001). Conclusion: It is evidenced that the level of MDA is increased in both types of DM. There is significant increase in levels of plasma Total cholesterol, TGL, LDL and VLDL and significant decrease in levels of HDL in both types of DM. Key Words: Lipid peroxide, IDDM, NIDDM, MDA (Malondialdehyde), Lipid Profile.
INTRODUCTION Insulin Secretion and action1: Glucose concentration is the key regulator of insulin action. The principal anti hyperglycaemic actions of insulin are- Insulin reduces the production of gluconeogenic precursors such as glycerol, alanine and lactate, reduces activity of hepatic gluconeogenic enzyme. Increases hepatic glycogenolysis to glucose, reduced hepatic glucose output, increase cellular glucose uptake mediated by GLUT4, reduces competition for glucose oxidation by alternative fuels, initiation of NEFA release from adipose tissue, reduces hepatic ketogenesis, insulin promotes glucose storage as glycogen. In diabetes due to deficiency of insulin, despite high blood glucose levels, cells ‘starve’ since insulin stimulated glucose entry into cells is impaired. TAG hydrolysis, FA oxidation, gluconeogenesis and ketone body formation are accelerated2. Lack of insulin leads to mobilization of substances for gluconeogenesis and ketogenesis from muscle and adipose tissue, accelerated production of glucose and ketone by the liver and impaired removal of endogenous and exogenous fuels by insulin responsive tissues. The net results are severe hyperglycaemia and hyperketonemia that overwhelm renal removal mechanism3. Insulin affects many sites of mammalian lipids metabolism. It stimulates synthesis of FA in liver, adipose tissue and in the intestine. Insulin increases cholesterol synthesis and the activity of lipoprotein lipase activity in white adipose tissue is increased4. Common form of dyslipidaemia in DM is that hypertriglyceridaemia with reduced HDL levels5 Once diabetes has developed, increased concentrations of LDL cholesterol and decreased concentrations of HDL cholesterol appear. Elevated serum triglycerides with low HDL cholesterol and increased LDL are common in type 2 diabetic patients without significant hypercholesterolemia6. In diabetes due to absence of insulin, hormone sensitive lipase is activated, more FFA are formed, these are catabolised to produce acetyl COA. As available oxaloacetate is less, acetyl COA is not readily utilized. So increased Acetyl COA is channelled to cholesterol synthesis leading to increased serum cholesterol levels7. Hormone sensitive lipase hydrolyses triglycerides to glycerol and fatty acids 8. The activity of endothelial insulin dependent lipoprotein lipase activity is less resulting in diminished triglyceride clearance from triglyceride rich lipoproteins. This results in hypertriglyceridemia. The low lipoprotein lipase activity results in impaired lipolysis of VLDL and reduced formation of HDL particles 9. Participants of the study group were selected from the outpatients population of Department of Diabetology, Thanjavur Medical College, Thanjavur. 100 patients were selected for this study. Out of which 50 patients belong to NIDDM and 50 to IDDM group. 50 persons served as healthy control. All ambulatory NIDDM and IDDM patients without any complications were included into study while Smokers, Alcoholics, Renal failure, Bronchial. Asthma, History Suggestive of Complications of DM, Angiopathy, Cardiopathy patients were excluded from study. For all the patients, fasting and postprandial blood samples and fasting urine samples were collected. For blood sugar estimation, blood collected in fluorinated tube. For other investigations in plain tube samples were collected. Serum malondialdehyde was estimated by YAGI Method. For estimation of Lipid profile general system parameters were Used with this Kit: Reaction Type: Endpoint Reaction Slope: Increasing Wavelength: 500 nm (492-550) Flowcell Temp: 30° C Incubation: 5 Min. at 37°C Sample Vol: 10 μL Reagent Vol: 1.0 mL Std. Concentration: 200 mg/dL Zero Setting With: Reagent Blank The instrument was set using above system and measured by Colorometric test. Un-paired t-test was used for statistical analysis.
RESULT Table 1: MDA and HbAIC
Overall the Values of Good control (HbAIC <7) Mean ± S.D and Poor control (HbAIC >7) Mean ± S.D were 4.14 ± 0.1 and 4.54±0.17 in IDDM and 4.37 ±0.08 and 4.92±0.33 in NIDDM and in Total DM Cases were 4.26 ±0.15 and 4.73±0.32 i.e. Significantly less in IDDM( P<0.0001).
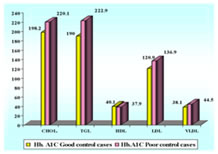
Table 2: HbAIC and Lipid profile in DM Cases
Average Lipid values for cases With good control (HbAIC < 7) Mean + S.D. were Significantly less and HDL high than With poor control (HbAIC >7) Mean + S.D. (P<0.0001). Lipid Profile in DM cases with good and poor HbA1C values
Figure 1:
DISCUSSION The mean value of plasma MDA is high in diabetic patients when compared to control group. Increased lipid peroxidation in diabetes mellitus is due to excess formation of free radicals10. Hyperglycaemia in diabetics causes increased glycation of protein which itself act as a source of free radicals. Metabolic derangements in diabetes lead to an increase in concentration of oxidizable substrates and compromised detoxification pathways. The study shows that cases on insulin as therapeutic regime (IDDM) had lower mean MDA level (4.46 μmol/L) as compared to those on oral hypoglycaemics (NIDDM) (4.8 μmol/L) indicating lesser level of oxidative stress in diabetics on insulin. Considering MDA levels among cases on the basis of their glycaemic status, significant correlation is seen between well controlled and poorly controlled diabetics (both in IDDM and NIDDM). MDA is higher in individuals with poor glycaemic control compared to good glycaemic control. For every 1% reduction in HbAIC, one can expect 35% reduction in microvascular complications11.Which can be attributed to decrease in oxidative stress on treatment. The metabolic parameters such as total Cholesterol, Triglycerides, LDL and VLDL values were more in diabetic groups than the control groups. Mean value of serum HDL is decreased in diabetic group compared to control and decrease is statistically significant (P = 0.001). Most common lipid disorder observed in DM is the presence of high plasma Triglyceride and low HDL cholesterol12. Insulin is the principal antilipolytic regulator, acting on hormone sensitive lipase. Without its action as in DM, lipolysis in adipose tissue is increased. As a result there is increased availability of NEFAS for reesterification in the liver to produce more triglycerides. Lipoprotein lipase activity is less in insulin deficiency resulting in diminished Triglyceride clearance, impaired lipolysis of VLDL and reduced formation of HDL particles13. Insulin increases the number of LDL receptor. In insulin deficiency, the level of LDL receptors are low, which causes the increase in LDL cholesterol. LDL oxidation plays an important role in atherogenesis14-19. In our study we have found that Overall the Values of Good control (HbAIC <7) Mean ± S.D and Poor control (HbAIC >7) Mean ± S.D were 4.14 ± 0.1 and 4.54±0.17 in IDDM and 4.37 ±0.08 and 4.92±0.33 in NIDDM and in Total DM Cases were 4.26 ±0.15 and 4.73±0.32 i.e. Significantly less in IDDM ( P<0.0001). Average Lipid values for cases With good control (HbAIC < 7) Mean + S.D. were Significantly less and HDL high than With poor control (HbAIC >7) Mean + S.D. (P<0.0001) . These findings are in confirmation with Jain Meenu et al20 . They found HbA1c showed direct and significant correlations with cholesterol, triglycerides, LDL and VLDL and inverse correlation with HDL.
CONCLUSION It is evidenced that the level of MDA is increased in both types of DM. There is significant increase in levels of plasma Total cholesterol, TGL,LDL and VLDL and significant decrease in levels of HDL in both types of DM. To conclude in the era of modern medicine diabetic complications demand prevention and management. The estimation of lipid peroxide along with lipid profile in diabetes mellitus is very useful as it may serve as a useful monitor to judge the prognosis of the patient. The detection of risk factor in the earlystage of the disease will help the patient to improve and reduce the morbidity rate. It is with this background that the ray of hope provided by the considerable evidence suggesting the role of prevention of increased lipid peroxidation could offer feasible and cost effective way to reduce the prevalence of diabetic complications.
REFERENCES
Policy for Articles with Open Access
|
|
|||||||||||||||||||||||||||||||||||||||||||||
 This work is licensed under a Creative Commons Attribution-NonCommercial 4.0 International License.