 Home
Home
|
Table of Content - Volume 4 Issue 2- November 2016
A study of prevalence of metabolic syndrome in newly detected diabetes mellitus type 2
Sanjay T Thorat1, Omkar R Patil2, Mayur Kondewar3*
1Associate Professor, 2,3Jr. Resident, Department of Medicine, Krishna Institute of Medical Science, Karad, Maharashtra, INDIA. Email: mayurkon@gmail.com
Abstract Background: The metabolic syndrome (MS) is described as clusters of abnormalities including abdominal obesity, insulin resistance, hypertension, hyperglycaemia, increased triglycerides, and decreased high-density lipoprotein cholesterol (HDL-C). Material and Method: All the patients aged > 18 years with newly detected Type 2 Diabetes Mellitus (< 6 months duration) admitted in Krishna institute of Medical Sciences. Classifying patients in four groups as (1) NCEP - ATP III, (2) Modified NCEP ATP III, (3) Modified WHO, (4)IDF - Presence of Central Obesity with waist circumference > 90 cm men and > 80 cm. Sample size: 100 patients. Results: Modified NCEP ATP III predicted MS in 60 patients (70%) and IDF criteria predicted MS in 40 (46%) patients which is least compared to others. Modified WHO and NCEP ATP III criteria’s were predicting MS 55(64%), 48(56%) respectively. Mean age of male is 47.23±9.82, mean age of female is 49.68±10.71, mean age of all cases is 48.60±10.48 comparing this age among male and female Z = 1.10, p>0.05.Mean and S.D of age (male) is 48.1±10.23. Mean and S.D of age (female) is 49.63±11.2. Mean age of all patients is 49.15 comparing this age among male and female Z - 0.53, p>0.05.By analyzing various individual parameters of MS in newly detected DM patients, high Triglycerides were present in 68(79%) patients(male-39,female-29) followed by raised SBP in 58(67.4%) patients(male-29, female-29). High fasting blood glucose was present in 55 patients, low HDL in 53 patients. Significant WC, waist hip ratio and significant BMI was seen in 44,40 and 40 patients respectively Conclusion: Modified NCEP ATP III criteria predicts highest occurrence of MS in newly detected type 2 DM patients. Elevated serum TG for men and decreased HDL for women were strongest single predictors, effectively indicating the presence of MS in newly detected type 2 DM patients. Key Words: Diabetes mellitus type2, duration of diabetes, metabolic syndrome.
The metabolic syndrome (MS) is described as clusters of abnormalities including abdominal obesity, insulin resistance, hypertension, hyperglycaemia, increased triglycerides, and decreased high-density lipoprotein cholesterol (HDL-C)1. The number of people with the metabolic syndrome also differs by sex, race, and ethnicity. Most patients with diabetes have metabolic syndrome with estimated prevalence of 69.9 per cent for Whites, 64.8 per cent for Blacks, and 62.4 per cent for Mexican Americans. Type 2 diabetes mellitus (T2DM) is a significant risk factor for coronary artery disease (CAD) and stroke1. At least 65 per cent of people with T2DM die of some form of heart disease and stroke2. Patients with T2DM have an increased prevalence of lipid abnormalities, which contribute to higher rates of CAD. High triglyceride and low HDL cholesterol levels were significantly related to all coronary heart disease events and to coronary mortality in patients with T2DM3. Moreover, the prevalence of CAD in diabetes patients increases significantly with the addition of MS components4. According to Third National Health and Nutrition Examination Survey (NHANES III) data, people who did not have MS, had the lowest risk for cardiovascular disease (CVD) events, those with MS had an intermediate level of risk, and those with diabetes had the highest level of risk 5
MATERIALS AND METHODS Source of data: All the patients aged > 18 years with newly detected Type 2 Diabetes Mellitus (< 6 months duration) admitted in Krishna institute of Medical Sciences. Methods of collection of data: (including sampling procedure) Informed and written consent was obtained from all the participants after explaining the procedure. The study protocol was approved by the Institute's Ethics Committee. Initial evaluation included a detailed history and clinical examination to exclude any systemic disease. Classifying patients in four groups as NCEP - ATP III Presence of > 3 of following
Modified NCEP ATP III - Presence of > 3 of the following
Modified WHO - Presence of diabetes and > 2 of the following
IDF - Presence of Central Obesity with waist circumference > 90 cm men and > 80 cm in women plus any 2 of following
Inclusion Criteria
Sample size: 100 patients Exclusion Criteria:
Mode of Collection:
OBSERVATIONS AND RESULTS
Table 1: Patients predicting MS based on different criteria
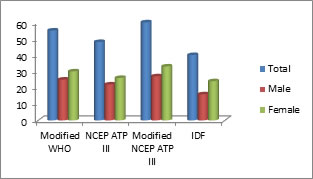
Figure 1: Patients predicting MS based on different criteria
By considering different criteria's for metabolic syndrome results showed that modified NCEP ATP III predicted maximum number of Metabolic Syndrome in newly detected diabetes when compared to other criteria. Modified NCEP ATP III predicted MS in 60 patients (70%) and IDF criteria predicted MS in 40 (46%) patients which is least compared to others. Modified WHO and NCEP ATP III criterias were predicting MS 55 (64%), 48 (56%) respectively.
Table 2: DM detection at different age group
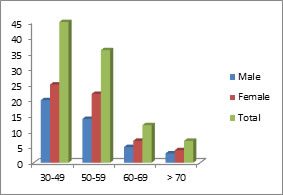
Figure 2: DM detection at different age group
Respect to age consideration, 45 patients were in the age group of 30- 49 yrs, 36 patients in 50-59 yrs, 12 patients in 60-69 yrs and 7 patients in more than 70 years. Mean and S.D of age (male) is 48.1±10.23. Mean and S.D of age (female) is 49.63±11.2. Mean age of all patients is 49.15 comparing this age among male and female Z - 0.53, p>0.05.
Table 3: Predicting MS at different age group
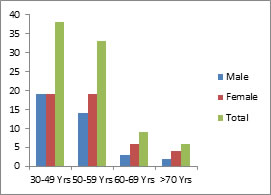
Figure 3: Predicting MS at different age group
In the age group 30-49 yrs, 38 patients (44%) were predicting MS and 6 patients (7%) were predicting MS more than 70 years. 33 patients (38.4%) and 9 patients (10.5%) were in the group 50-59 years and 60-69 years respectively predicting MS. Our study showed more number of newly detected diabetes predicting MS were 30-49 years and least in more than 70 years. Mean age of male is 47.23±9.82, mean age of female is 49.68±10.71, mean age of all cases is 48.60±10.48. comparing this age among male and female Z = 1.10, p>0.05.
Table 4: Duration of DM
Table 5: Various single parameters predictors of metabolic syndrome
By analyzing various individual parameters of MS in newly detected DM patients, high Triglycerides were present in 68(79%) patients(male-39,female-29) followed by raised SBP in 58(67.4%) patients(male-29, female-29). High fasting blood glucose was present in 55 patients, low HDL in 53 patients. Significant WC, waist hip ratio and significant BMI was seen in 44,40 and 40 patients respectively.
DISCUSSION In our study 100 pts of newly detected diabetes mellitus were included, among these 18 patients were detected as newly DM, at the time of admission, 28 patients had 1-3 months history of DM and 54 patients had 4-6 months history of DM. Among 100 newly detected DM patients 42 (42%) were males and 58 (58%) were females.
Table 6: Comparative studies predicting MS
Our study showed prevalence of metabolic syndrome varying from 46.95% (IDF), to 69.76 % (Modified NCEP ATPIII), by different criteria, in newly detected DM type 2 individuals. Prevalence of MS was 55.81% and 63.95 % according to NCEP ATP III, and modified WHO respectively. Study conducted by Ethiraj Dhanraj et al, showed prevalence of patients predicting MS in newly detected DM -type 2 was 64.47%, 56.83%, 67.85%, 62.34% according to modified WHO, NCEP ATP III, modified NCEP ATP III, IDF respectively. Almost similar percent of patients predicting MS seen in this study except the variation result was seen in IDF criteria. Carole et al, study using modified WHO,, NCEP ATP III and IDF criteria showed 38 %, 61%, and 54 % respectively. Thus comparing this study results were almost equal in respective NCEP ATP III, and IDF criteria. But difference was seen with modified WHO criteria. Charles et al study was predicting 43.5 % of MS according to NCEP ATP III criteria in newly detected type 2 DM where as our study is predicting 55.81% of patients. Caroles et al study was predicting less number of MS in newly detected DM patients according to modified WHO (41.3%), NCEP ATP 111(48.7%) criteria, when compared to our study with the same criteria.
Table 7: Comparative studies of MS with gender distribution
In our study with comparison to men, prevalence of MS was higher in women according to all 4 criteria's. 29 % vs. 35%, 25.6 % Vs 30.2 %, 31.4% vs 38.4% and 18.6% Vs 27.9 % according to modified WHO, NCEP ATP III, Modified NCEP ATP III and IDF criteria respectively. This result of sex distribution where MS was higher in women compared to men had similar observations with Ethiraj Dhanraj et al study, though the percent of female patients predicting MS was less in our study. Similarly, Sylvialey RD et al study showed prevalence of MS was higher in women (52%) than men (34 %) according to NCEP ATP III criteria Carlos et al study showed 39 % males were predicting MS according to WHO criteria in Diabetic patients, where as our study showed 29%. Giovanni et al study results showed almost equal number of patients of men and women predicting MS according to modified WHO but study had similar results showing women predicting high prevalence compared to men with respective to NCEP ATP 111 and IDF criteria. In our study, Age of the newly detected type 2 DM patients included were 30 years to 73 years. Maximum number of patients were in the age group of 30-49 years (45%) predicting MS 44%. and minimum in the age group of more than 70 years (7%) predicting MS 7%. Age between 50-59 years was 36% predicting MS 38.4% and 60-69 years were 12 % predicting MS 10.5%. Mean Age in our study was 49.15 years predicting metabolic syndrome in newly detected type 2 DM in this region. Study conducted by Timothy S et al was showing mean age of 52.4 years with MS and Type 2 DM, 46.8 years with only MS and 49.2 years with only type 2 DM. Charles M Alexander et al studied MS with type 2 DM only in the age group of more than 50 years and mean age was 65.5 years. Carlos Lorenzo et al study had mean age of 47.7 years.
Table 8: Comparative studies of mean age
Table 9: Comparative studies of single individual predictor of MS in type 2 DM
When considering single strongest predictor for MS in newly diagnosed type 2 DM. In our study Triglyceride was showing in 79% of patients which was maximum compared to SBP (67.4%), FBS (64%), HDL (61.6%), WC (51.2%), Obesity (46.5%) and BMI (46.5%). In Charles et al study it was FBS (90.2%) which was single strongest predictor for MS in type 2 DM compared to WC (86%), SBP (82.7%), TG (72%), HDL (69.7%), BMI (30.9%). So, This study has almost similar results to our study in respect to HDL, TG but variations seen in respect to SBP and FBS. Sylvia et al study result showing HDL and WC both had maximum predictor each 53 % and FBS 21% the lowest predictor for MS by applying NCEP ATP III criteria, where as in our study SBP and HDL showing 87.5 % each prediction for MS and WC (70.8%) showing the lowest prediction for MS by NCEP ATP III criteria. In the same study by applying IDF criteria WC was the single strong predictor of MS which was 91 % and TG predicting lowest, where as in our study WC and central obesity with each 60 % showing maximum prediction to MS by IDF criteria. In Giovanni et al study showed SBP had significant prediction for MS in WHO criteria than NCEP ATP III and IDF criteria, central obesity was predicting in 96% for MS. In our study SBP was 83.6% by modified WHO Criteria, 87.5 % and 75% by NCEP ATP III and IDF criteria respectively. Central obesity was predicting MS only in 46.5 %. Timothy et al study had mean values of SBP 131.7, HDL 37.3, TG 247.3, WC 107 cms and BMI 31.0 Hsieh et al study showed obesity, hypertension, low HDL were significant by modified NCEP ATP III criteria.
CONCLUSION Modified NCEP ATP III criteria predicts highest occurrence of MS in newly detected type 2 DM patients. Elevated serum TG for men and decreased HDL for women were strongest single predictors, effectively indicating the presence of MS in newly detected type 2 DM patients.
REFERENCES
Policy for Articles with Open Access
|
|
|||||||||||||||||||||||||||||||||||||||||||||||||||||||||||||||||||||||||||||||||||||||||||||||||||||||||||||||||||||||||||||||||||||||||||||||||||||||||||||||||||||||||||||||||||||||||||||||||||||||||||||||||||||||||||||||||||||||||||||||||||||||||||||||||||||||||||||||||||||||||
 This work is licensed under a Creative Commons Attribution-NonCommercial 4.0 International License.