 Home
HomeOfficial Journals By StatPerson Publication
|
Table of Content Volume 11 Issue 1 - July 2019
A study of drug utilization pattern of antihyperglycemic agents in diabetes mellitus cases of a rural Telangana population
Kulkarni Dhananjay1*, J Divya Sree2
1Associate Professor, 2Phase III MBBS Student, Department of Pharmacology, Mahavir Institute of Medical Sciences, Vikarabad, Telangana. Email: ksdhanu@rediffmail.com
Abstract Background: Diabetes is becoming major public health problem in low- and middle-income countries. India shares the highest burden of diabetic cases in the world. Diabetes over a period leads to various organ system complication, thereby increasing treatment cost. Hence it’s prudent to have rational drug utilization pattern in diabetes cases especially in rural areas. This study aims to assess the same. Material and Methods: Prospective, observational Pharmaco-epidemiological study was carried out in Medicine out-patient department for a period of two months and 200 Antihyperglycemic agents (AHA) containing prescriptions pattern were studied. Drug Utilization (DU) 90% was used to assess rationality of prescription and was calculated based on defined daily dose (DDD) with their respective value in Anatomical Therapeutic Chemical (ATC) classification code. Defined daily dose is calculated as DDD/1000/day. Results: Monotherapy forms (69.42%) of AHA were more preferred than combination form (30.58%). Metformin was the commonest AHA prescribed. Glimepiride+Metformin+Voglibose is the commonest Fixed dose combination of AHA prescribed. Cost of AHA per prescription was 170.20rs. 50% of prescribed AHA constituted to DU90% segment. Conclusion: Newer class of AHA were least preferred. More generic drug prescription needed to bring down cost of AHA per prescription. Prescription was largely rational as not more than 50% of prescribed AHA constituted to DU90%. Keyword: DU90%, FDC, DDD, AHA, prescription pattern, Diabetes mellitus (DM).
INTRODUCTION India has witnessed a rapidly exploding epidemic of diabetes in recent years and currently leads the world with the largest number of diabetic subjects in a single country.1 WHO projects diabetes will be the 7th leading cause of death by 2030 and more than 80% of diabetes deaths occur in low- and middle-income countries. 2 The prevalence of diabetes in India is expected to increase from 31.7 million in 2000 to 79.4 million in 2030.3 Diabetes over a period of time leads to complications and thereby causing more burdens on the treatment cost.4 The International Network for the Rational Use of Drugs (INRUD) promotes the rational use of drugs in various countries. INRUD in collaboration with WHO has provided objective indices for assessment of drug- use practices.5 Drug utilization study is a crucial section of pharmaco-epidemiology with the definitive aim to assist rational use of drugs amongst the population.6, 7 Drug utilization (DU) 90% is an innovative approach to assess rational drug prescribing. Using this approach, the drugs that represent 90% of the drug prescription/sales volume are identified.8 The rationale behind DU90% rests on an assumption that a low number of products prescribed is associated with more rational prescribing practices. Furthermore, the approach can be used to assess what proportion of the drugs that represent 90% of the volume is made up by drugs listed in essential drug list.9 The defined daily dose (DDD) is the assumed average maintenance dose per day for a drug used for its main indication in adults. It will only be assigned for drugs that already have an Anatomical Therapeutic Chemical (ATC) classification code.10 Drug consumption data presented in DDDs only give a rough estimate of consumption and not exact picture of actual use. DDD is most commonly calculated as DDD/1000/day.11 Irrational use of drugs in health care system globally is a major concern.6,12,13 Therefore, it is essential to evaluate the drug utilization patterns from time to time, to enable appropriate modifications in prescribing patterns to increase the therapeutic benefit and decrease the adverse effects for the patients. This current study aims to do the same by studying drug utilization pattern of AHA in diabetes patients of rural areas of Telangana.
MATERIALS AND METHODS A prospective, non interventional, cross sectional (observational) study was carried out in the Medicine out-patient department of our Institute. Necessary Institutional ethics committee clearance for the conduct of the study was taken. The study was conducted over a period of two months. During the study period AHA containing prescriptions were included in the study. Prescriptions of Gestational diabetes patients, diabetes In-patients admitted in hospital, severe diabetic cases with complication (critical care unit admitted cases) or patients who refuse to give consent for the screening of their prescriptions were not included. Since it was a non-invasive and descriptive study, patient’s willingness to screen their prescription will be considered as their consent. Personal details of the patients were kept confidential. Descriptive statistical analysis of the data using tabular forms, percentage and bar diagrams was done. Data on demographic parameters, prescription indices, fixed dose combinations and cost per prescription were highlighted. DU90% was calculated based on number of prescriptions as well as by defined daily dose (DDD) with their respective value in Anatomical Therapeutic Chemical (ATC) classification code. Here Defined daily dose is calculated as DDD/1000/day and the formula used was.
RESULTS A total of 200 diabetic patient prescriptions were screened during the study period. Table – 1A highlights demographic profile of the study. Type-2 Diabetes Mellitus (DM) cases were more predominant (96%) than type-1 DM cases (04%). Table-1B details prescription indices of the study. Number of anti-hyperglycemic agents (AHA) prescribed in 200 prescriptions was 340. The average AHA prescribed per prescription was 1.7. Number of AHA prescribed in generic form was 64 (18.82%). Table-1B also depicts average cost of AHA per prescription. In this present study it was 170.2rs. Table-2 shows details of oral AHA prescription. Monotherapy form (69.42%) was more prescribed than FDC form (30.58%). In monotherapy form, metformin was most commonly prescribed (41.47%). Furthermore metformin was the most common ingredient among all FDCs prescribed. Among FDCs, three drug combinations of glimepiride, metformin and voglibose was most commonly prescribed (22.35%).
Table 1: Demographic and prescription Indices
*As per National list of essential drug list 2015.43 Table-3 shows details of Defined daily dose (DDD) of prescribed AHA and its utilization in the form of DDD/1000/day. Table-3 also shows 50% (four) of the overall (eight) prescribed AHA constituting to DU90%. Table 2: Details of monotherapy and FDC forms of prescribed AHA
* Of 56 prescription of insulin, 39 were prescribed in mixed form (regular + isophane), 9 were in short acting plane form and remaining 8 were prescribed in long acting form.
Table 3: Details of DDD and AHA constituting to DU90%
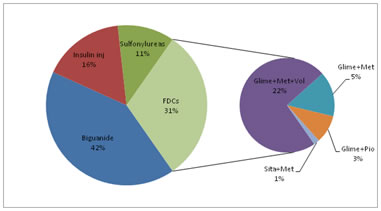
Figure-1 shows class wise percentage of AHA prescribed. Biguanides were most commonly prescribed and combination of Metformin with sulfonylureas was commonly prescribed FDCs. Figure-1: Class and FDC distribution of anti-diabetic drug prescribed DISCUSSION Greater prevalence (54%) of diabetes in males as compared to females (46%) seen in this study. Similar prevalence is seen in a study conducted in urban areas of Telangana.11 While many studies have reported higher prevalence of DM in males.14,15 whereas other showed female predisposition.16 Although there is an increase prevalence of type-1 diabetes mellitus (DM) in India, but the major driver of diabetes prevalence in India is from type-2 DM, which accounts for more than 90 per cent of all diabetes cases.17 In this study, 98% cases belongs to type-2 DM. Similar findings of high type-2 DM prevalence was also seen in urban areas of Telangana.11 The average age of onset of DM in India is 42.5 years.18, 19 In present study maximum (55%) diabetic cases are from 41-60 years age group. In concordance with our study findings, Upadhyay et al, and Venkateswaramurthy et al also reported a higher incidence of diabetes in the similar age group.18, 19 The high incidence is attributed to a combination of genetic susceptibility plus adoption of a high-calorie, low-activity sedentary lifestyle by India's growing middle class.20In this present study average number of drugs per prescriptions was 3.34, which is less compare to other similar study, where it was high (6.70)11, indicating polypharmacy. Average number of AHA per prescription in the present study is 1.7, which is similar to 1.79 noted in east Indian study. 72.94% of the AHA prescribed in this study was as per National essential drug list 2015. This is much higher compare to various other studies11,21 were it ranges from 34.18% to 43.24%, thus indicating rational prescribing in the present study. Average cost of AHA per prescription in this study is 170.2rs, which is less compare to other study.22 Lower incidence of polypharmacy, coupled with higher prescription of low cost AHA belonging to National essential drug list in this study indicates a rational prescription approach. However major area of concern in the present study was lesser prescription of AHA in generic form, which is only 18.82% (64). This generic prescription is low when compared to prescription study of AHA in post menopausal women23 were 24.6% of AHA were prescribed in generic form. In this study monotherapy form of AHA (69.42%) was more preferred than FDC(30.58%) form. This was in contrast to a study24 conducted in Mumbai, where FDCs were more preferred (60%) than monotherapy. However various studies19,21 noted more prevalence of monotherapy over FDCs. Overall metformin monotherapy was the most common AHA (41.47) prescribed in the current study. This finding is similar to various studies11,25 were metformin constitutes the bulk of AHA prescription. However in some studies especially involving diabetes In-patients (IP), Insulin was the most preferred monotherapy form.26 In this study, glimepiride was the most common AHA prescribed in sulfonylurea class. This finding is similar to a study25 conducted in Kerala where glimepiride constitutes the bulk of sulfonylurea class prescription. In this present study, fixed dose combination of metformin with glimepiride and voglibose was most commonly prescribed FDC. Majority of the prescribed FDCs in the present study contains metformin, which is true in various other similar studies.24, 21 In current study newer class of AHA were least prescribed, that too as a part of FDCs and not as monotherapy form. This observation was also noted in a study conducted by Agarwal et al27 where less number of newer classes of AHA were prescribed. Lesser preference to newer AHA class prescription was mainly due to cost factor, as affordability is the major concern among rural patients. Size of the DU90% segment helps us to assess rational prescribing. A very large number of drugs in the DU90% segment indicate less rational prescribing. On the other hand, a small number of drugs in DU90% could suggest a more rational prescribing. The assumption that less is better is used as prescribing indicator in DU90%.9 In this study only 50% of the prescribed AHA (both mono and FDCs together) constituted to DU90% (Table-3), which largely suggests a rational prescribing when compared to Nigerian study where DU90% was constituted by more than 65% of the prescribed AHA.28
CONCLUSION Metformin was the most common AHA prescribed in monotherapy form. Further there is a clear emphasis on overall use of biguanide and sulfonylureas as preferred fixed dose combination therapy. Newer classes of AHA were least preferred in this study. Prescription was largely rational as not more than 50% of prescribed AHA constituted to DU90%. Greater need of generic prescription is required to further bring down the cost of AHA per prescription (170.2rs in this study). Evidence-based medicine in the form of large scale pharmaco-epidemiological study, covering different rural areas will bring out clear prescribing trends of AHA. This will provide valuable inputs to policy makers and prescribers, thereby enabling them for safe, cost effective and rational prescription of AHA.
REFERENCE
|
|
|||||||||||||||||||||||||||||||||||||||||||||||||||||||||||||||||||||||||||||||||||||||||||||||||||||||||||||||||||||||||||||||||||||||||||||||||||||||||||||||||||||
 This work is licensed under a Creative Commons Attribution-NonCommercial 4.0 International License.