 Home
HomeOfficial Journals By StatPerson Publication
|
Table of Content Volume 12 Issue 3 - Decembery 2019
Pharmacoeconomic analysis of oral hypoglycaemic drugs used in treatment of patients of diabetes mellitus in medicine OPD of a tertiary care hospital in northern India
Divya Singh1*, K K Sawlani2, S C Chaudhary2, A K Sachan3, R Nath3, Suchi Jain1, Syed Shakita Fatima1, R K Dixit3
{1Junior Resident, 3Professor, Department of Pharmacology and Therapeutics} {2Professor, Department of Medicine} K.G.M.U., Lucknow, Uttar Pradesh, INDIA. Email: 1508divya.dr@gmail.com
Abstract Background: Type 2 DM is the most common form of DM and accounts for about 90% of all diabetes cases in the world. Treatment of diabetes is expensive and is soaring worldwide. According to WHO it is expected that the global expense of managing diabetes will almost double itself from 234 billion in 2007 to about 411 billion in the coming two decades. Given the prevalence and complications of diabetes an analysis to determine the economic impact of the treatment option being prescribed in tertiary care hospital of northern India. This study aims at conducting a pharmacoeconomic analysis of oral hypoglycaemic drugs used in the treatment of diabetes mellitus. Material and Methods: 89 diabetes patients coming to outpatient department of medicine of King Georges medical university were included in this study after obtaining consent. Data in terms of monetary units as input and gain in health in terms of improvement in blood sugar level and reduction in Hb1Ac for pharmacoeconomic evaluation was recorded for cost minimization analysis and cost effectiveness analysis Result: In monotherapy, glipizide 5mg was the cheapest while voglibose 0.2mg was the most expensive drug while in combination therapy glimepiride 1 mg + metformin 500 mg was the cheapest while sitagliptin 50 mg + metformin 500 mg was the most expensive drug. Minimum percentage cost variation was seen with teneligliptin 20mg in monotherapy while in combination therapy minimum percentage cost variation was seen with sitagliptin 50 mg + metformin 500 mg. Minimum annual drug cost was seen for metformin 500mg in monotherapy and glimepiride 1 mg + metformin 500 mg in combination therapy. For reducing fasting blood sugar, most cost-effective drug in monotherapy was metformin 500mg while glimepiride 1 mg + metformin 500 mg was most cost-effective in combination therapy. Same was noted for reducing HbA1C Conclusion: For reduction of blood sugar level and Hb1Ac metformin was found to be the most cost-effective therapy both as single as well as in combination. Key Words: pharmacoeconomics, antidiabetic, cost minimization, cost effectiveness, cost variation
INTRODUCTION Prevalence of both type 1 and type 2 DM is on a rise worldwide, the rise in type 2 diabetes prevalence is faster owing increases obesity, increased sedentary lifestyle and increasing proportion of aging population as a consequence of better medical facilities. Type 2 DM is the most common form of DM and accounts for about 90% of all diabetes cases in the world1. Treatment of diabetes is expensive and is soaring worldwide. According to WHO it is expected that the global expense of managing diabetes will almost double itself from 234 billion in 2007 to about 411 billion in the coming two decades 2. An estimated 336.6 USD national income will be lost as in the coming decade as calculated on the basis of loss of productivity due to the diabetes and its associated cardiovascular and cerebrovascular complications3. Data from 2016 study done by WHO shows that 63% of all the deaths in India were due to non-communicable diseases (NCDs) of which diabetes contributed to 3% and 13% were caused by other non-communicable4 Burden of non-communicable disease in India in 2010 accounted for more disability-adjusted life years (DALYs) than communicable illnesses – approximately 235 million versus 222 million DALYs, respectively 5. The contributors to disability adjusted life years (DALY) increased from 30.5% in 1990 to 55.4% in 2016 6. The economic burden calculated for the years 2012 -2030 contributed by Diabetes was 0.15 trillion dollars in 2010. Given the prevalence and complications of diabetes an analysis to determine the economic impact of the treatment option being prescribed in tertiary care hospital of northern India. A pharmacoeconomic study thus becomes necessary to throw light on the current approaches to the rational use of anti-diabetic drugs in type II diabetes mellitus patients visiting the medicine out-patient department, and to calculate the economic burden of different anti-diabetic therapies prescribed to patients with type II diabetes mellitus 7. Knowledge of costs related to diabetes helps to improve understanding, addressing health care and prevention issues associated with diabetes.8
MATERIAL AND METHODS The study was conducted at the Department of Pharmacology and Therapeutics in collaboration with Department of Medicine, King George’s Medical University, Lucknow. The study was started after ethical clearance from the institutional ethics committee (IEC) of King George’s Medical University, Lucknow (Ref code: 93rd ECM II B- Thesis/P24) . All patients with proven diabetes mellitus type 2 and put on oral antidiabetic medications were recruited from the Department of Medicine of King George’s Medical University. The total duration of study was 10 months i.e. November 2018 to August 2019 Subject Selection All patients with diabetes mellitus type 2 and put on oral antidiabetic medications were screened for the study. Those who satisfied the inclusion/exclusion criteria were included in the study after taking written informed consent. Inclusion criteria
Exclusion criteria
Study Design The diagnosis of diabetes mellitus type 2 was confirmed prior to enrolment. Patients were allotted a unique patient identification number for ease of follow up. On the first visit, a case record form designed as per the study protocol was filled according to the prescription of the patient (which included treatment charts, and investigation reports of patients of medicine, direct drug acquisition cost). Measurement of the blood glucose level was also done on the first visit. The patient medication chart was recorded every follow up visit and at 3 months for keeping a record of prescriptions and improvement in terms of clinical parameters. If any serious interaction was observed, health care professional for necessary modifications was informed. The patient was followed up, on the second visit (1 month, 3 month), recharting blood glucose level was done to calculate the cost effectiveness of the drug and compare it with other alternative treatment option. The economic data was obtained from the hospital billing and pharmacy billing departments and even some of the details from the patient and patient caretakers. Data obtained from the case record form and charting of the various clinical parameters after being collected was analysed and results were calculated using appropriate statistical tests. Cost of various drugs were calculated from current index of medical specialities (CIMS October 2018- January 2019). Intervention No specific intervention was done in the patients enrolled for the study. The intervention done by the treating physician was only monitored.
RESULTS
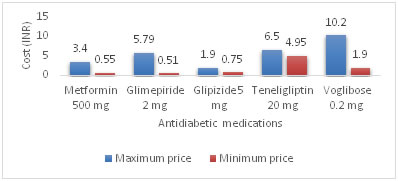
Percentage cost variation in cost of oral antidiabetic medications in monotherapy were analysed. The drug with minimum cost variation was teneligliptin 31.31 % followed by acarbose which was 66.66 %. Whereas maximum cost variation was found in metformin. Rest all the drugs showed a significantly wide cost variation of >100 %. The cost variation in various antidiabetic agents in monotherapy is shown in table and figure Table 1: Cost minimization analysis for single antidiabetic drug
Figure 1: Cost difference [maximum and minimum] of commonly used hypoglycemic drugs as monotherapy
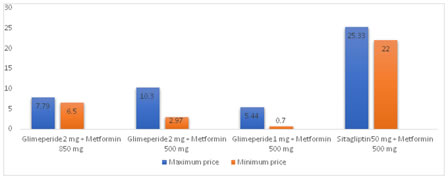
Cost variation analysis for drugs used in combination therapy showed minimum cost variation between Sitagliptin 50 mg + metformin 500 mg combination of 15.1% followed by glimepiride 2 mg + Metformin 850 mg combination of 19.8 %. Cost variation amongst rest of the combinations was also found to be less except glimepiride + metformin combination which was >100%. Table 2: Cost minimization analysis for antidiabetic FDC drug
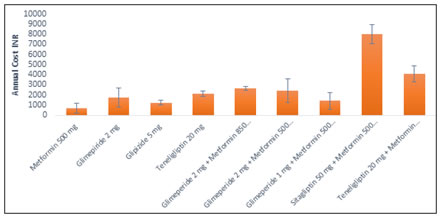
Figure 2: Cost difference [maximum and minimum] of commonly used in combination of hypoglycemic drugs Minimum annual drug cost was seen for metformin 500 mg of 684.61 rupees per annum in monotherapy and glimepiride 1 mg + metformin 500 mg with a total annual drug acquisition cost of 1408.9. Maximum annual cost amongst monotherapy was seen for teneligliptin 20 mg for rupees 2110 in monotherapy and sitagliptin 50 mg + metformin 500 mg combination for rupees 7987.11 per annum. Table 3: Drug acquisition cost for single antidiabetic drug according to class of drugs
Drug acquisition (daily and annual) costs of the different antidiabetic drugs prescribed in the outpatient clinic., CPD= Cost per Day; CPY= Cost Per Year. (Both CPD and CPY in Indian Rupees)
Figure 3: Annual drug acquisition cost of drugs of antihypertensive medications being prescribed in mean (± S.D.)
Cost effectiveness of antihypertensives is analysed by calculating average cost effectiveness ratio (ACER) and incremental cost effectiveness ratio (ICER). Cost incurred in rupees for reduction in fasting blood sugar (FBS) and Hb1AC were calculated and assessed.
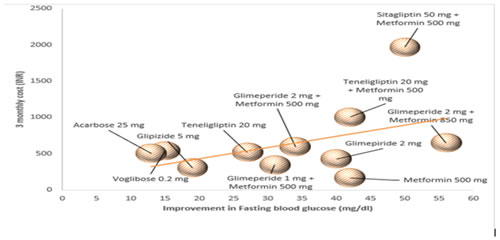
As per our study most cost-effective in monotherapy was metformin 500 mg with an ACER of 4.0 followed by glimepiride 2 mg with and ACER of 10.66. Amongst antidiabetic combinations being used glimepiride 1 mg + metformin 500 mg and glimepiride 2 mg + metformin 850 mg an ACER of 11.2 and 11.6 respectively. For ICER calculation in monotherapy, keeping metformin 500 mg as the comparator drug only teneligiptin 20 mg was found with a positive ICER of was found be most cost effective with ICER of 23.44.In combination therapy keeping glimepiride 1 mg + metformin 500 mg as the comparator most cost effective drug was glimepiride 2 mg + metformin 850 mg with an ICER of 12.12.
Most cost-effective drug in monotherapy as per ACER was found to be metformin 500 mg followed by glimepiride 2 mg with ACER of 143.84 and 474 respectively. Whereas amongst the combinations of antidiabetic s glimepiride 1 mg + metformin 500 mg was most cost effective with ACER of 385.55. For ICER with similar comparator drugs as for fasting blood sugar most cost-effective drug was none of the drugs were more cost effective than monotherapy as the cost ICER ratio for rest all of the drugs were negative in monotherapy. In combination therapy teneligliptin 20 mg + metformin 500 mg with ICER of 1643.5 was the most cost-effective combination in terms of ICER
Figure 4: A graphical representation of average reduction in fasting blood glucose with per unit increase in cost of the drugs
Table 5: Cost effective analysis of antidiabetic medications for fasting blood sugar
$= dominated by Metformin 500 mg
Table 6: Cost effective analysis of antidiabetic medications for HbA1C
$= dominated by metformin 500 mg; and= dominated by glimepiride 1 mg + metformin 500 mg Data from cost effectiveness ratio was subjected to analysis of variance (ANOVA) to determine whether there is any significant difference in ACER (average total direct cost per unit reduction in blood pressure) between different treatment antihypertensive medication groups. Difference in ACERs between treatment groups was significant (p<0.001) for monotherapy and very highly significant for combination therapy (p<0.001)
DISCUSSION Cost Minimization of oral antidiabetics Percentage cost variation in cost of oral antidiabetic medications in monotherapy showed minimum cost variation in teneligliptin followed by acarbose. Maximum cost variation was found in metformin. Rest of the drugs showed a wide cost variation of more than 100 %. This finding suggests availability of more brands in metformin as compared to other drugs and total cost of treatment can be reduced drastically by using the cheapest brand of metformin and prescriber should avoid writing the costliest brand of metformin in order to curtail the total cost of drug therapy. Cost variation analysis for drugs used in combination therapy showed minimum cost variation between sitagliptin 50 mg + metformin 500 mg combination followed by glimepiride 2 mg + metformin 850 mg combination. Cost variation amongst rest of the combinations was also found to be less except glimepiride + metformin combination which was more than 100%. In one study Dharani et al 9, the minimum and maximum percentage price variation for different classes of drugs varied. In Single drug therapy sulfonylurea group of drugs, glimepiride (2mg) and glicazide (80mg) showed maximum and minimum price variation of 730.93% and 165.55% respectively. Among biguanides and thiazolidinediones groups, metformin (500 mg) and pioglitazone (15mg) showed maximum price variation of 402.92% and 483.33% respectively. In α-glucosidases inhibitor group of drugs, voglibose (0.2mg) showed maximum price variation of 451.28 %. In combination therapies glimepiride and pioglitazone combination showed the maximum variation up to 307.7%. In another study Dupaguntla et al 10, among sulfonylurea group of drugs, glimepiride (1 mg) showed maximum price variation of 892%. The price variation of metformin (500 mg), pioglitazone (15 mg) and vildagliptin were 492%, 486.1% and 1.91% respectively. In α-glucosidase inhibitors voglibose showed maximum price variation of 151.4 %. In combination therapies, glimepiride+ metformin (1 mg + 500 mg) combination showed the maximum variation of 346 % Cost effectiveness analysis of oral antidiabetics Cost effective analysis is one of the most commonly applied forms of economic analysis in drug therapy. It determines the cost variation between different therapies with similar results in a particular therapeutic area. India being the diabetes capital of the world, plus the chronic nature of diabetes leads to the cost associated with the disease being enormous. The main purpose of pharmacoeconomic evaluation is not to directly alter the therapeutic decisions of the physicians, but to help the physicians, pharmacists and policy makers to make informed decisions about whether the cost and extra benefits of the new drug are meaningful within the given budget. When cost effectiveness for fasting blood sugar is considered, metformin (4) was higher than glimepiride 2mg (10.66) in monotherapy. while in combination therapy, cost effectiveness of glimepiride 1 mg + metformin 500 mg (11.2) was higher than glimepiride 2 mg + metformin 850 mg (11.7) and glimepiride 2 mg + metformin 500 mg (17.52). when cost effectiveness for hba1c is considered, metformin (143.84) was higher than glimepiride 2mg (474) in monotherapy. while in combination therapy, cost effectiveness of glimepiride 1 mg + metformin 500 mg (385.55) was higher than glimepiride 2 mg + metformin 850 mg (591.545) and glimepiride 2 mg + metformin 500 mg (647.60) Study by Limaye et al 11, glimepiride+ pioglitazone cost least (INR 3.7) per unit of effectiveness in case of non-obese participants while metformin (INR 6.7) and glimepiride+ metformin (INR 5.9) were similar in terms of cost per unit of effectiveness in case of obese participants. Another study by Singh et al 7, the cost per unit (1 mg/dl) reduction in FBG (ACER) was highest with FDC of insulin degludec and insulin aspart (INR 217.38) and lowest with FDC of glipizide and metformin (INR 10.46). Among the OADs, the ACER was highest with voglibose (INR 62.79).
CONCLUSION In monotherapy, glipizide 5mg was the cheapest while voglibose 0.2mg was the most expensive drug while in combination therapy glimepiride 1 mg + metformin 500 mg was the cheapest while sitagliptin 50 mg + metformin 500 mg was the most expensive drug. Minimum percentage cost variation was seen with teneligliptin 20mg while maximum variation was seen with glimepiride 2mg in monotherapy while in combination therapy minimum percentage cost variation was seen with sitagliptin 50 mg + metformin 500 mg and maximum percentage cost variation was seen with glimepiride 2mg + metformin 500mg.Minimum annual drug cost was seen for metformin 500mg in monotherapy and glimepiride 1 mg + metformin 500 mg in combination therapy. Whereas maximum annual cost was seen with teneligliptin 20 mg in monotherapy and sitagliptin 50 mg + metformin 500 mg in combination therapy. For reducing fasting blood sugar, most cost-effective drug in monotherapy was metformin 500mg while glimepiride 1 mg + metformin 500 mg was most cost-effective in combination therapy. Same was noted for reducing HbA1C. Data from this study can help from base for cost effectiveness determination of various oral hypoglycaemic options for medical management of patients. Though standard international guidelines lay down the principles and recommendations for drug therapy but cost effectiveness of the various treatment options can help rationalize therapy for providing optimum health care in limited resources.
ACKNOWLEDGEMENT I would like to express my gratitude to faculty and staff of Department of medicine, K.G.M.U. and all my co-authors for their contribution and support.
REFERENCES
|
|
|||||||||||||||||||||||||||||||||||||||||||||||||||||||||||||||||||||||||||||||||||||||||||||||||||||||||||||||||||||||||||||||||||||||||||||||||||||||||||||||||||||||||||||||||||||||||||||||||||||||||||||||||||||||||||||||||||||||||||||||||||||||||||||||||||||||||||||||||||||||||||||||||||||||||||||||||||||||||||||||||||||||
 This work is licensed under a Creative Commons Attribution-NonCommercial 4.0 International License.