 Home
HomeOfficial Journals By StatPerson Publication
|
Table of Content - Volume 11 Issue 2 - August 2019
The haematological profile with fifty generations of undernutrition cannot be reversed with six generations of a recuperation diet in a wistar rat colony
M M Karandikar1, A R Joshi2, M S Karandikar3*
1Assistant Professor, 2Professor and HOD, Department of Physiology, Bharati Vidyapeeth Medical College, Dhankawadi, Pune, INDIA. 3Professor, Department of Physiology, D.Y. Patil Medical College, D.Y. Patil University, Pimpri, Pune, INDIA. Email: mskarandikar@yahoo.com
Abstract David Barker and colleagues in Southampton, England were trying to identify all-cause mortality and morbidity in the English population. They found out that undernutrition during foetal life was primarily responsible for the adult morbidity and mortality. These adaptations or “Programming” were necessary for survival of the foetus in an unfavourable environment. Poor health of the mother during pregnancy was responsible for the increased risk of cardiovascular disease, stroke and diabetes in these offspring. This led to the articulation of “The Foetal Origins of Adult Disease” hypothesis which states that, “Undernutrition in foetal life acts to program the risk for early onset of disease in the adult life”. Similar studies carried out in India have revealed the “Thin-Fat” Indian phenotype. These initial observations have been confirmed later by many human and animal studies. We have previously reported that Wistar Rats (Thrifty Jerry) that have been undernourished for fifty generations show leukopenia, macrocytic anaemia and increased platelet count. The present study tried to evaluate if a standard rat diet (Recuperation diet) provided could reverse the harmful effects of 50 generations of undernutrition. The blood indices and the platelet count were restored after 6 generations of a recuperation diet. However, the white blood cell count was higher along with the presence of lymphocytosis and granulocytosis .6 generations of the recuperation diet could not completely reverse the effects of multigenerational (50 generations) undernutrition. Key Words: Foetal Programming, Multigenerational Undernutrition, Complete Blood Count, Recuperation Diet
INTRODUCTION David Barker’s epidemiological studies in Southampton, England showed that under-nutrition in foetal life leads to adaptations that can be detrimental in adult life. His thus pioneered the concept of “Foetal Origins of Adult Disease” (Godfrey and Barker 2000). This work has been substantiated and expanded by both animal as well as many human studies. These adaptations or “programming” are a result of the changes that are at a hormonal, cellular as well as metabolic level (McMillan and Robinson 2005). Yajnik et al have studied these adaptations in the Indian population and have found that Indians at birth are centrally obese, insulin resistant but have a lower soft tissue mass, “The Thin-Fat Phenotype” (Yajnik, Fall et al 2003).As a result of these adaptations, coronary heart disease, hypertension and Diabetes Mellitus in developing countries like India is very common and has assumed epidemic proportions (Echouffo-Tcheugui 2012).We have studied the effects of multigenerational undernutrition in a Wistar rat model (Thrifty Jerry) and have shown that these rats mimic the Indian phenotype. These animals are centrally obese, show insulin resistance, deficiency of Vitamin B12 and folate levels along with lower soft tissue growth (Hardikar et al 2015).Studies carried out on the hematopoietic environment in undernourished animals have shown the presence of hypocellularity, necrosis, and extracellular matrix modifications (Travlos GS (2006), Fried W et al (1978), Vituri CL(2000), Prestes-Carneiro et al (2006) and Borelli P et al(1995).The Thrifty Jerry rats showed the presence of leukopenia, macrocytic anaemia and increased platelet count with fifty generations of undernutrition (M.M.Karandikar et al).The present study evaluated the role of providing a standard rat diet (recuperation diet) to the undernourished animals (transition colony) for 6 generations. MATERIALS AND METHODS The undernourished wistar rat colony was given a standard rat pellet diet for 6 generations- “Transition Colony”.10-week-old adult female rats from the 6th generation of the transition colony were studied. The control group received a standard rat feed. Blood was collected by retro-orbital bleeding and serum was immediately separated and analysed for Complete Blood Count (CBC) on an auto analyser (Mindray BC2800). The study was ethically approved by the institutional ethics committee. Statistical Analysis All estimations were carried out in triplicates and values are expressed as +/- Std Error of Mean (SEM). The statistical significance was evaluated by the unpaired t test using Graph Pad Prism 6 version software. RESULTS Table 1: Complete Blood Counts in Control and Transition Adult Wistar Rats
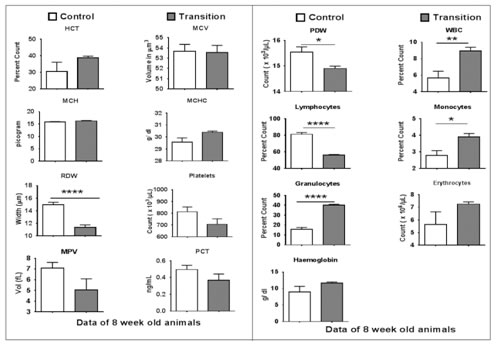
Significance: * p< 0.01, ** p<0.001, ***/****P<0.0001 DISCUSSION The foetal origins of adult hypothesis proposed by David Barker and his colleagues analysed the role of foetal undernutrition and diseases in adult life. His studies have shown that foetal undernutrition cause hypertension, coronary heart disease and type 2 diabetes in adult life. (Godfrey and Barker 2000). These adaptations labelled as “programming” are due to adjustments in a variety of systems that occur during fetal life and occur at the structural, metabolic and hormonal level. Since David Barker’s studies, human and animal studies have confirmed and modified these initial observations and is now called as Developmental Origins of Adult Disease (DoHAD) (McMillan and Robinson 2005). The Pune Maternal Nutrition Studies (PMNS) by Yajnik et al have studied the Indian scenario that have led to the understanding of “Thin-Fat” Indian phenotype [Yajnik, Fall et al (2003), Yajnik and Deshmukh, (2012)]. We have carried out studies in a Wistar rat model (Thrifty Jerry) that has been undernourished for 50 generations. The animals were insulin resistant, centrally obese and had smaller visceral organs (Hardikar et al).Studies carried out so far have primarily focused on the endocrine, metabolic, cardiovascular and renal adaptations to undernutrition. A few studies have evaluated the role of undernutrition on the haemopoietic environment and have shown the presence of Hypocellularity, necrosis and and extracellular matrix modifications (Travlos GS (2006), Fried W et al (1978), Vituri CL (2000), Prestes-Carneiro et al (2006) and Borelli P et al (1995). However very few studies have evaluated the role of multigenerational undernutrition (50 generations). We have previously reported the role of multigenerational undernutrition on the blood cell counts and have shown leukopenia, macrocytic anaemia and increased platelet count in these animals (M.M. Karandikar et al). This study has evaluated the role of providing a standard rat diet (Recuperation diet) to the undernourished animals for 6 generations. The transition colony showed the presence of leucocytosis (5.70 in Control vs 8.94 in Transition x103/μL). This was associated with granulocytosis (15.87 vs 40.08 %) and lymphopenia (81.38 vs 56.02%). This was suggestive of a state of acute infection. This exact cause is unknown and would require further evaluation. The macrocytic anaemia as seen in the undernourished colony was completely corrected with 6 generations of a recuperation diet. MCV (53.68 vs 53.56 μm3) and MCHC (29.58 vs 30.40 g/dl) was normalized. Red cell count, hematocrit and hemoglobin levels were also normal in the transition colony. This showed that 6 generations of a recuperation diet could completely reverse the macrocytic anemia. Hardikar et al have evaluated the same effect in 2 generations of a recuperation diet. They could show partial improvement but the changes were not completely reversed. 6 generations of the recuperation diet were required to reverse the changes of macrocytic anemia. Interestingly red cell distribution width showed a significantly lower value (14.97 vs 11.34) showing cells that had no anisocytosis or poikilocytosis. This needs further evaluation. This study also showed that platelet levels were normalized in the transition colony after 6 generations of the recuperation diet. We have not carried out bone marrow studies nor have we looked the epigenetic changes that could be involved in this transition colony. Further studies that would involve both bone marrow evaluation and epigenetic studies could throw light on the adaptations and reversal of the macrocytic anaemia and restoration of the platelet count. The presence of granulocytosis is indicative of an acute state of infection in these animals. This study has thus shown that 6 generations of a normalised diet could not completely reverse the effects of 50 generations of undernutrition in the Thrifty Jerry Colony.
Figure 1: Blood Cell Count in Control and Transition Figure 2: Blood Cell Count in Control and Transition Adult Female Wistar Rat Adult Female Wistar Rat CONCLUSIONS Multigenerational undernutrition for more than 50 generations that causes macrocytic anaemia can be reversed with 6 generations of a recuperation diet. This is however associated with leucopoenia, granulocytosis and lymphopenia indicative of an inflammatory state. REFERENCES
|
|
 This work is licensed under a Creative Commons Attribution-NonCommercial 4.0 International License.