 Home
HomeOfficial Journals By StatPerson Publication
|
Table of Content - Volume 11 Issue2 - August 2019
Partial restoration of the haematological profile in 4-week-old pups after six generations of improved nutrient supply
M M Karandikar1, A R Joshi2, M S Karandikar3*
1Assistant Professor, 2Professor and HOD, Department of Physiology, Bharati Vidyapeeth Medical College, Dhankawadi, Pune, INDIA. 3Professor, Department of Physiology, D.Y. Patil Medical College, D.Y. Patil University, Pimpri, Pune, INDIA. Email: mskarandikar@yahoo.com
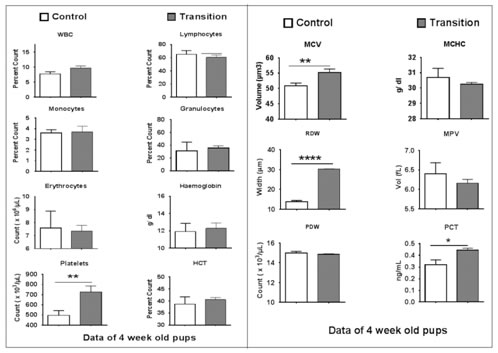
Abstract David Barker’s epidemiological studies in England and Wales found that impaired growth during intra-uterine life leads to increased risk for cardio-vascular disease, diabetes and cancers in the developing foetus. He attributed this to the poor health of the pregnant mothers causing foetal undernutrition. The developing foetus shows “adaptations” to the sub-optimal environment called as “programming” that primarily include endocrine and metabolic adaptations as well as epigenetic and apoptotic changes along with decreased cell numbers in various tissues. A majority of these studies in both animal and human populations have primarily focused on cardio-vascular, renal and endocrine adaptations to undernutrition. We have previously shown that 50 generations of undernutrition in a Thrifty Jerry Wistar Rat colony causes hypoplasia of the bone marrow. The present study has evaluated the effects of diet restoration for 6 generations (recuperation) on the haematological profile in 28-day pups in this multigenerationally undernourished colony. This Transition (Recuperation) colony after 6 generations of the normalised diet showed a higher Mean Corpuscular Volume (55.20 vs 50.87 μm3) as compared to the control colony and a high RBC distribution width (30.26 vs 13.75). Platelet count (724.6 vs 496.2 x 10³/microliter) and Plateletcrit (0.4498 vs 0.3203) was also higher in the recuperation colony. We have previously shown that 2 generations of the recuperation cannot completely the reverse the changes that result due to 50 generations of undernutrition. However,6 generations of the recuperation diet leads to the correction of the anaemia but worsens the platelet count. This study has important consequences in a developing country like India Key Words: Foetal Programming, Multigenerational Undernutrition, Complete Blood Count, Pups, Recuperation Diet
INTRODUCTION Worldwide studies have shown an increasing burden of Type 2 Diabetes Mellitus and cardiovascular disease in developing countries like India. (Echouffo-Tcheugui 2012). Evidence from a variety of studies have shown that this occurs due to poor nutrition during foetal life leading to intrauterine growth retardation (IUGR) and development (Godfrey and Barker 2000). Such an insult during the intrauterine life leads to adaptations during foetal life called as “programming”. These adaptations involve hormonal, metabolic, chemical and structural changes during foetal life (McMillen and Robinson 2005). The Indian phenotype shown by Yajnik et al provide such evidence of foetal programming during the gestational period. The Pune Maternal Nutrition Study has described the “Thin-Fat” Indian phenotype. This phenotype, present at birth is centrally obese, insulin resistant but has a lower soft tissue weight. This probably is a consequence of multigenerational programming due to undernutrition (Yajnik, Fall et al 2003).We have previously shown that 50 generations of multigenerational undernutrition in a Wistar rat model (Thrifty Jerry) shows similar insulin resistance, central obesity along with higher homocysteine, vitamin B12 and folate levels. These animals show increased susceptibility to diabetes and ischemic heart disease (Hardikar et al). The diet restriction is also known to lead to alterations causing necrosis, hypocellularity and extracellular modifications of the matrix. (Travlos GS (2006), Fried W et al (1978), Vituri CL (2000), Prestes-Carneiro et al (2006) and Borelli P et al (1995). We have previously evaluated the role of multigenerational undernutrition on the haematological profile of 4-week-old Wistar pups. Bone marrow hypoplasia was a characteristic feature along with an increase in inflammatory response. (M M Karandikar et al). The present study evaluated the role of six generations of a standard (recuperation) diet in the multigenerationally undernourished colony pups.
MATERIALS and METHODS Wistar rats that were undernourished for 50 generations received a standard rat diet (transition rat colony) for 6 generations (Hardikar et al 2015).The control group received a standard rat feed.28 day pups were bled retro-orbitally and the Complete Blood Count (CBC) was measured on an auto-analyser (Mindray BC2800 ).The study was ethically approved by the institutional ethics committee. Statistical Analysis All estimations were carried out in triplicates and values are expressed as +/- Std Error of Mean (SEM). The statistical significance was evaluated by the unpaired t test using GraphPad Prism 6 version software. RESULTS Table 1: Complete Blood Counts in Control and Transition Wistar Rat Pups (28 Day)
* p< 0.01, ** p<0.001, ***/****P<0.0001
DISCUSSION David Barker and his colleagues in Southampton, England were analysing the cause of early mortality and morbidity in England and Wales. They found out that the poor health of the mothers was responsible for the many changes or “adaptations” in the developing foetus, called as programming. These adaptations were responsible for the increased risk of cardio-vascular disease, diabetes mellitus and cancers. He thus formulated the concept of “foetal origins of adult disease” which stated that “intrauterine factors, particularly nutrition, act in early life to program the risks for adverse health outcomes in adult life” (Godfrey and Barker 2000). The programming is a result of the adaptations of the various organ systems to under-nutrition during key stages of development. A variety of epidemiological observations and animal studies have confirmed such an association. (McMillen and Robinson 2005). Yajnik et al, in the Pune Maternal Nutrition Study (PMNS) have described the “Thin-Fat Indian phenotype”, a result of undernutrition during foetal life (Yajnik, Fall et al (2003), Yajnik and Deshmukh, (2012).The animal and human studies carried out so far have primarily focused on the cardiovascular, renal and metabolic adaptations. Very few studies have evaluated the role of chronic undernutrition and its effect on the haemopoietic environment. We have previously described the role of multigenerational undernutrition (50 generations) on the hematopoietic environment in a Wistar rat colony (The Thrifty Jerry Colony) that showed hypoplasia of the bone marrow along with granulocytosis. (M M Karandikar et al). The present study evaluated the role of providing a standard diet for 6 generations to the multigenerationally undernourished rat colony on the hemopoietic environment (The Transition Colony).The undernourished colony had shown a hypoplastic bone marrow as seen by decreased Total Leukocyte Count, Red blood Cell Count, Platelet count and Haemoglobin concentration (M M Karandikar et al). Restoration of the diet for 6 generations could restore the total leukocyte count, Red blood Count and haemoglobin concentration to normal. Mean Corpuscular Volume showed an increase in the transition colony (55.20 vs 50.87 x 10³/μL). A previous study carried out by Hardikar et al have shown partial restoration of the blood indices after 2 generations of the recuperation diet. Restoration of the diet for 6 generations in the transition colony thus showed complete reversal of the macrocytic anaemia. It required 6 generations to restore normality after 50 generations of undernutrition. The study also found out an increased RBC distribution width (RDW) in the transition colony indicative of anisocytosis and poikilocytosis. The exact cause for this needs to be evaluated. A normalization of the White Blood Cell counts was also seen in these pups after 6 generations of a normalised diet. However, an increased platelet count (724.6 vs 496.2 x 10³/μL) and plateletcrit (0.44 vs 0.32) in the transition colony was also observed. The cause of the increased platelet count needs further investigation.6 generations of the recuperation thus could not completely reverse the effects of 50 generations of undernutrition. We have not carried out epigenetic studies to evaluate the role of a recuperation diet on restoration of the hypoplastic bone marrow. This study would further enable us to provide an understanding into the role of the recuperation diet on changes in the hemopoietic environment.
Figure 1: Blood Cell Count in Control and Figure 2: Blood Cell Count in Control and Transition Wistar Rat pups (28 days) Transition Wistar Rat pups (28 days) CONCLUSION This study has shown that 6 generations of providing a standard or recuperation diet could not completely reverse the effects of 50 generations of undernourishment. Future studies that would involve animals that have been provided with a recuperation diet over many more generations along with epigenetic studies may be able to throw light on restoration of the hemopoietic environment in the undernourished rats.
REFERENCES
|
|
 This work is licensed under a Creative Commons Attribution-NonCommercial 4.0 International License.