 Home
HomeOfficial Journals By StatPerson Publication
|
Table of Content - Volume 12 Issue 1 - October 2019
Pattern of changes in haemoglobin concentration in Antarctica expedition members
I B Udaya*, C C Laxmi#, Polash Sannigrahi$, T N Satyaprabha†, Shripad PatilΨ
1Institute of Aerospace Medicine, Bangalore, INDIA. #Associate Professor, Department of Physiology, GITAM Institute of Medical Sciences and Research, Visakhapatnam, INDIA. $ Institute of Aerospace Medicine, Bangalore, INDIA. †HOD, Department of Neurophysiology, National Institute of Mental Health and Neurosciences, Bangalore, INDIA. ΨProfessor, JALMA National Institute for Leprosy and Other Mycobacterial (ICMR) Agra, INDIA. Email: laxmicariappa@gmail.com
Abstract Background: Antarctica is the least explored continent owing to numerous inclement conditions. Polar nights and polar days are unique to this continent, which pose challenges to human survival, especially in long duration expeditions. Variation in Haemoglobin concentrations during prolonged stay in this polar environment have not been studied much and limited literature is available in this regard. Objective: To find changes in the haemoglobin concentration in humans upon exposure to Antarctic environmental conditions over a period of fourteen months. Methodology: The study group consisted of twenty four expedition members who winter overed in Indian Antarctic Station (Maitri) over a period of 14 months. Haemoglobin levels of the expedition members were estimated during various phases of expedition using the acid-haematin method. The pre-expedition sample was estimated in INDIA, prior to launch of expedition in the month of December 2006, the second sample was estimated in February 2007 whilst in Antarctica (polar days), the third sample in May 2007 (polar nights), the fourth sample in August 2007 (polar nights) and the final sample estimation was done in February 2008 (polar days). Results: Haemoglobin concentration values showed a seasonal variation with a dip during polar nights. It rose subsequently, but did not reach pre-expedition values. Conclusion: The findings imply that haemoglobin concentration decreases during polar winters and increases during polar summers in Antarctica which is directly related to exposure to sunlight and dietary intake. Key Word: Antarctica Expedition, Haemoglobin, Polar night, Nutrition
INTRODUCTION Antarctica is considered the darkest, coldest, windiest and possibly the most hostile region for humans on Earth. About 98% of Antarctica is covered by ice that averages 1.9 km (6,200ft) in thickness.1 Antarctica has just two seasons, summer and winter. During summer, at the poles, there is almost four months of constant sunlight and in winter there is almost four months of total darkness.2 More than a hundred years after Captain Robert Falcon Scott led the Terra Nova Expedition (1910-1913) to the Antarctic, our understanding of the stresses caused by Antarctic extremes and how the body reacts to severe exercise, malnutrition, hypothermia, high altitude, and sleep deprivation has advanced.3 About 1100 people winter over in Antarctica every year.4 These people are ideal to carry out medical research. Prolonged stay in Antarctic environment poses few unique challenges to human physiology, but exposure to polar days and polar nights and restriction of fresh food provokes medical researchers. Exposure to high altitude is known to raise haemoglobin (Hb) concentration5 but the changes in the haemoglobin concentration in humans upon exposure to cold climatic conditions for extended duration has shown varying results and has not been subject to much research. Fishes living in polar latitudes have shown adaptation in haemoglobin to survive in extremes.6 Previous studies on humans in Antarctica have also shown seasonal variation of haemoglobin concentration in polar regions.7 However, there is scarcity of documented evidence regarding the pattern of haemoglobin concentration in the expedition members during polar days and polar nights through their prolonged stay at Antarctica.
METHODS Subjects: This study presents the changes in the haemoglobin concentration of the expedition members during various phases of expedition. It was carried out on 24 expedition members with mean age of 38.3±1.7 years. All the subjects were males and Indian nationals. The Institutional Ethics committee clearance was obtained from the Ethics Committee of NIMHANS, Bengaluru. Written informed consent of the participants were obtained prior to enrolment and they were briefed regarding the details of the study. Settings: The study was carried out at “Maitri” (70045'52" S and 11044'03" E) which is an Indian permanent station located at an altitude of about 50 m AMSL in Schirmacher Oasis, Antarctica. The temperature inside the station is regulated between 15°C to 24°C. The expedition members had various types of outdoor activities regularly during which they were exposed to harsh environmental conditions. The data was collected between December 2006 and February 2008. The Hb levels were estimated for a total of five times at different intervals. The first estimation was carried out after finalisation of team members in INDIA just prior to launch of expedition in December 2006, where ambient day temperature was about 28°C. Second estimation was done after reaching Antarctica winter station (Maitri) in February 2007 during which they experienced polar days, where ambient temperature ranged between 0°C to14°C. The third estimation was done after five months of stay in Antarctica i.e. in May 2007 during which expedition members experienced polar nights and the ambient temperature ranged between −22°C to −08°C. The Hb% estimation was repeated in August 2007 during which expedition members continued to experience polar nights and the ambient temperature ranged between −28°C to −12°C. The final reading was recorded in February 2008 prior to completion of expedition and members were experiencing polar days and ambient temperature ranged between −14°C to 0°C (Table 1). The period of Hb% estimation was timed to study the effect of sunlight and probable effect of availability of fresh food on expedition members. The data collected have been analysed and presented in this study. Measurements: Venous blood was drawn from the ante-cubital vein of the members, and within 10 minutes, the haemoglobin concentration (Hb%) was estimated using Sahli’s acid haematin method. As the Principal Investigator performed all the tests himself, every time, the scope of personal bias in colorimetric readings and laboratory operations could be disregarded. Statistical analysis: The collected data was analysed using Microsoft Office Excel 2007 and the Hb% values were compared with the pre-expedition values and the results obtained are represented graphically (Fig. 2 to 5). RESULTS The Hb% values of all the 24 members before start of the expedition and during monthly intervals of the expedition are tabulated in Table I.
Table 1: Values of Hb concentration before, during and at the end of Antarctic expedition
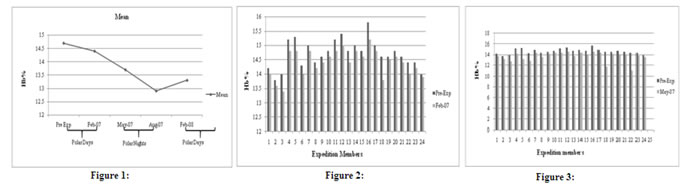
A comparison of the Hb% values between Pre-Expedition and various intervals during the expedition (Fig. 1) revealed that the Hb% values which were 14.7±0.5 g/dl in Dec 2006, reduced to 14.4±0.5 g/dl in Feb 2007. The values reduced further to 13.7±0.9 g/dl in May 2007, reaching the lowest mean of 12.9± 1.1 g/dl in Aug 2007. This was followed by an increase in values to 13.3±0.8 g/dl as observed in Feb 2008. Further, the Hb% values of all the 24 members, taken at monthly intervals, were also individually compared with their Pre-Expedition values and the comparison is represented graphically (Fig. 2 to 5).
Figure 1: Comparison of mean Hb% values between pre-expedition and at various intervals during expedition; Figure 2: Comparison of Hb% values between Pre-Expedition and after 75 days (February 2007), during polar days in Antarctica; Figure 3: Comparison of Hb% values between Pre-Expedition and after 160 days (May 2007), during polar night in Antarctica.
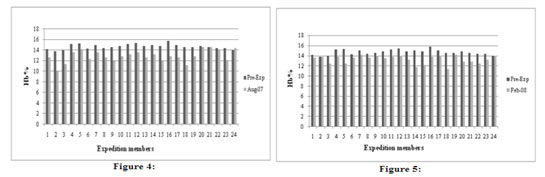
Figure 4: Comparison of Hb% values between Pre-Expedition and after 250 days (Aug 2007), during polar night in Antarctica; Figure 5: Comparison of Hb% values between Pre-Expedition and after 400 days (February 2008) during polar days in Antarctica.
DISCUSSION Haemoglobin is the iron-containing protein in red blood cells. It is composed of four polypeptide globin chains, each with an iron containing haem molecule8 which plays the major role of transporting oxygen to the tissues. Our study was planned to observe the variation in haemoglobin concentration over polar winters (polar nights) and polar summers (polar days) in Antarctica. A comparison of the Hb% values between pre-expedition and various intervals during expedition revealed that there was a progressive reduction in Hb% values (as compared to pre-expedition values) from February to August 2007 (Antarctic winter/polar nights). This was followed by an increase in Hb% as observed during February 2008(Antarctic summer/polar days), though the Hb% did not return back to their pre-expedition values. Few researches carried out on Antarctic polar plateau whose altitude is of 2,300 m in terms of oxygen partial pressure has shown an increase in haemoglobin concentration (polycythaemia) as a result of a greater production of erythrocytes in combination with a reduction in volume of blood plasma by enhanced excretion of water and salt.9,10 A gradual acclimatisation to altitude, through hypoxia-sensitive gene and protein expression, improves cellular respiration efficiency and over tens of days, there is increase in Hb%.9 In the current study, as the Indian Antarctic Station is situated only 120 meters above the Mean Sea Level, the influence of altitude on Hb% of the expedition members is negligible.11,12 The results of our study are in consonance with Finsen (1894), Isachsen (1911) and Odin (1937) who found a seasonal variation of Hb%. They found that Hb% dropped in the winter and rose during the summer months.7 In addition, Grimsgaard (1910) in northern Norway also reported a decrease in Hb% during the dark winter months. The rise in Hb% has been attributed to the influence of ultra-violet rays on the formation of Hb (Odin) as well as to the diet of the subjects. The role of diet on changes in the blood haemoglobin concentration has been well reported. Narinder et al. conducted a study on 32 members of the XVI Indian Scientific Expedition to Antarctica and concluded that supplementation with vitamin C and vitamin E would have the potential to produce beneficial changes in the body weight, body fat per cent, haemoglobin and lipoprotein lipid profile.13 This was also observed in our study, as during initial period of the expedition, the members were well fed with fresh ration including dry fruits, fresh vegetables, meat, fish etc. However, during later stages of the expedition, their diet comprised of only preserved or ready-to-eat meals. It is hypothesised that absence of fresh ration and consequently a deficiency of nutrients required for erythropoiesis may have resulted in reduction of Hb% values in the members. This hypothesis appears to get substantiated by the observation of increase in Hb% values by February 2008, as the food stock got replenished with fresh rations in December 2007. The peak winter (winter solstice) in Antarctica was on 21st June 2007. During the 4 month period around the winter solstice (2 months before to 2 months after the winter solstice) i.e. from May to August 2007, there was very minimal sunlight. It was observed that the Hb concentration reached to a minimum value (12.9±1.1 g/dl) at the end of this period i.e. in August 2007. Hb concentration less than 13 g% (<13 g/dl) in adult males is considered anaemia, as per the guidelines of World Health Organisation. The anaemic status of the expedition members noted at this point of time can be attributed to the absence of sunlight and hence the deficiency of Vitamin D. The role of sunlight in synthesis of vitamin D is well known. Similarly, the role of Vitamin D in erythropoiesis had been suggested by several clinical observations. Sim JJ et al. had conducted a cross-sectional analysis on 554 subjects. They had observed the presence of anaemia in 49% of 25-hydroxyvitamin D-deficient subjects compared with 36% with normal 25-hydroxyvitamin D levels. Their study demonstrated an association of vitamin D deficiency and a greater risk of anaemia, lower mean haemoglobin, and higher usage of erythrocyte-stimulating agents.14 Atkinson MA et al had performed a cross-sectional study of 10,410 children and adolescents aged 01-21 years and concluded that 25(OH)D deficiency is associated with increased risk of anaemia in children.15 In addition, the administration of analogues of vitamin D has been associated with an improvement of anaemia and reduction in requirement of Erythrocyte Stimulating Agents.16 However, several investigators have reported a rise in haemoglobin concentration on exposure to Antarctic winters. Ekelof (1904) of the Swedish Antarctic Expedition (1901-04), found an increase of Hb% during the second winter. MacLean (1919) of Mawson's Antarctic Expedition (1911-14) showed a rise in Hb% during mid-winter and reported that several Arctic expeditions had found no diminution in Hb% during the dark months. Studies by Claudia Strewe et al. at the German station Neumayer III (situated at sea level) in Antarctica revealed that the haemoglobin concentrations were moderately elevated during the period of February, March, and June to October when compared to baseline data but fluctuated in the normal range.17 In view of the above, it could be ascertained that both the factors i.e. non-availability of fresh rations, as well as absence of sunlight during the winter months contributed towards the progressive reduction of Haemoglobin concentration and there by resulting in anaemic status of the expedition members during this period. Our study had certain limitations such as small sample size, use of Sahli's Haemoglobinometry method for estimation of Haemoglobin concentration, non-availability of facilities for estimation of vitamin D level in the members during expedition. However, the study has attempted to explain the variation in Haemoglobin concentration in Antarctica expedition members during their prolonged stay of 14 months.
CONCLUSION This study is a first of its kind, which shows the variation in haemoglobin concentration in 24 expedition members during their 14 months stay in Antarctica. Haemoglobin concentration decreased during the polar nights and rose during polar days. Based on the current literature survey, the role of sunlight and nutrition could be attributed for such variations. Further studies could be conducted with a large sample size and advanced investigatory methods to substantiate the same. The decrease in haemoglobin concentration in expedition members during polar nights may be prevented to certain extent by timely intake of dietary supplements like B complex, vitamin C and D and iron depending on the work profile of the expedition members.
REFERENCES
|
|
 This work is licensed under a Creative Commons Attribution-NonCommercial 4.0 International License.