 Home
Home
|
Table of Content - Volume 13 Issue 1 - January 2020
Evaluation of motor response in normal healthy individuals with different levels of physical activity using motor unit recruitment pattern
Manju Latha K1, G Umamaheshwari2*
1Assistant Professor, Department of Physiology, Mallareddy Institute of Health Sciences, MRIMS. 2Assistant Professor, Department of Physiology, Vishwabharathi Medical College. Email: manjulathak86phy@gmail.com
Abstract Background: Physical training alters the appearance of skeletal muscles and can produce changes in muscle performance. Aims and Objectives: To evaluate the effect of activity on the muscle performance/ motor response. To evaluate the effect of physical activity on the motor unit threshold values. To evaluate the effect of physical activity on the force of muscle contraction[amplitude] and to comment on the relationship between the motor unit recruitment and levels of physical activity. Materials and Methods: This study was an experimental trial in which 90 normal healthy individuals from the year Oct 2012-June 2013. Subjects were divided into three groups control group [n=30], training group which included one with 10 % of physical activity [n=30] and the other group with 20 % of physical activity [n=30]. Results: In present study all the groups participant distribution had similar percentages (33.33%). Cases (20% of activity) had TH1 mean 10.3 ± 1.06 P value (0.007) which was statistically significant and controls 12.33 ± 0.99(<0.001) which is also statistically significant. While comparing TH parameters TH1, TH2, TH3, TH4, TH5, TH6, TH7, TH8, TH9 showed statistical significance. For Comparison of mean F1 across study group Cases (20% of activity) and controls showed statistical significance and between study group FB4, F5, F6 showed no statistical associations. Conclusion: In both the groups the required threshold had shown declining trend and the force of contraction was increased. The difference in the threshold and force of contraction was statistically significant between 10% and 20% group after each round of physical activity. Key Words: Motor Unit, Physical Activity, muscle performance, muscle contraction
INTRODUCTION Regular physical activity is associated with important health benefits, including reduced risk for premature death, cardiovascular disease, ischemic stroke, type 2 diabetes, colon and breast cancers, and depression.1Regular physical activity throughout one's life span is recommended to promote and maintain good health and prevent premature mortality.2 Moreover, an active lifestyle/exercise has been associated with more positive mood states, reduced risk of depression and better health-related quality of life (HRQoL) in the general population.3 Physical training alters the appearance of skeletal muscles and can produce changes in muscle performance. Conversely, a lack of use can result in decreased performance and muscle appearance. Although muscle cells can change in size, new cells are not formed when muscles grow.4 The muscle fibers react to prolonged exercise by adaptation to a higher level of performance.5 It is well known that a program of endurance exercise training can result in significant increases in muscle mitochondrial density and oxidative enzyme activity but has minimum effect on glycolytic enzymes.6 Because control of muscle is realized at the level of the motor unit (a motor neuron and the muscle fibers it innervates), it seems important to consider the physiological properties of motor units (MUs) when attempting to understand and predict muscle fatigue. Indeed, the few hundred MUs that make up a typical mammalian muscle usually possess wide ranges of contractile properties including force capacities, contractile speeds, and fatigabilities.7 Muscle fibres within a single motor unit have similar biochemical and contractile properties, meaning that individual motor units have distinct physiological and mechanical properties.8 Muscles can alter the force they produce by changing the firing frequency of the active motor units and changing the number of motor units that are active at any one time.9 Motor unit recruitment is the process by which different motor units are activated to produce a given level and type of muscle contraction. At minimal levels of muscle contraction (innervation), muscle force is graded by changes in firing rate (rate coding) of individual motoneurons (MNs).10In situations where rapid force production is required, however, there is strong evidence to suggest that there should be a mechanical basis for force production and hence motor unit recruitment.11 Activation of motor units in a random order produces a roughly linear force increase with progressive recruitment, whereas recruitment of motor units in order of increasing force produces an approximately exponential force increase as the number of active motor units increases.12 We conducted the current study to evaluate the effect of activity on the muscle performance/ motor response. To evaluate the effect of physical activity on the motor unit threshold values. To evaluate the effect of physical activity on the force of muscle contraction[amplitude] and to comment on the relationship between the motor unit recruitment and levels of physical activity.
MATERIALS AND METHODS We conducted an experimental trial in which 90 normal healthy individuals both males and females of age group 18-25 yrs are taken as subjects. The study was conducted in Osmania medical college, Hyderabad in electrophysiology laboratory with lab tutor pro software on power lab supplied by ad instruments pvt. ltd, from the year Oct 2012-June2013.The subjects had engaged in any regular resistance exercise training for at least 6 months prior to start of experiment with no significant history of any neuromuscular or orthopaedic disorders [specifically for hand and wrist muscles]. Informed consent was obtained; study was approved by the University Ethics Committee. Subjects were given orientation prior to starting of experiment. Subjects were divided into three groups control group [n=30], training group which included one with 10 % of physical activity [n=30] and the other group with 20 % of physical activity [n=30]. Materials used in present the study included Stimulating bar electrode, Finger pulse transducer, Electrode cream, Strap, Cotton swab, Power lab equipment set up, Hand dynamometer. Statistical method; Categorical outcomes were compared between study groups using Chi square test. All Quantitative variables were checked for normal distribution within each category of explanatory variable by using visual inspection of histograms and normality Q-Q plots. Shapiro- wilk test was also conducted to assess normal distribution. Shapiro wilk test p value of >0.05 was considered as normal distribution. For normally distributed Quantitative parameters the mean values were compared across study groups using ANOVA (>2 groups). The change in the quantitative parameters, before and after the intervention was assessed by paired t-test. Data was also represented using appropriate diagrams like error bar. P value < 0.05 was considered statistically significant. IBM SPSS version 22 was used for statistical analysis.13 RESULTS A total of 90 subjects were included in the final analysis. In present study cases with 10% of activity, cases with 20% of activity and controls had similar percentage of 33.33%.
Table 1: Comparison of mean Age and gender across the study groups (N=90)
The age of cases (10% of activity)19.77 ± 1.19, Cases (20% of activity)20.27 ± 1.48 and Controls19.57 ± 1.63 was not statistically significant P value (0.162). In current study Male population in cases (10% of activity) was 17 (56.66%) and female population was 13 (43.33%), among Cases (20% of activity) Males were 19 (63.33%) and females were 11 (36.66%) whereas in controls males included were 14 (46.66%) while females were 16 (53.33%). No statistical association was found P value (0.425). (Table 1).
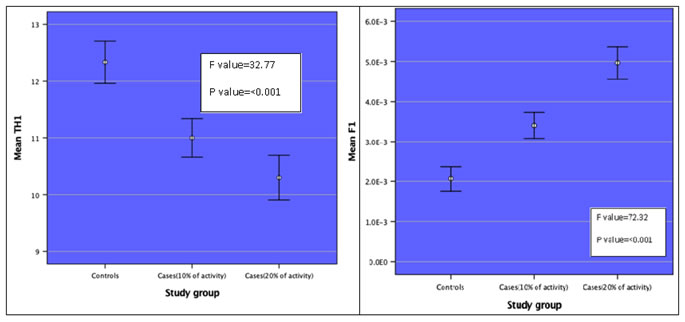
Figure 1 Figure 2 Figure 1: Comparison of average threshold of stimulus required for muscle contraction (N=90); Figure 2: Comparison of mean force of muscle contraction across the study groups (N=90) In figure 1, The average threshold of contraction required for contraction was 12.33 ± 0.99 among controls, 11 ± 0.91 among 10% activity and 10.3 ± 1.06 among subjects with 20% of activity (P value<0.001). This indicates that increase in intensity of physical activity will decrease the threshold of stimulus required for muscle contraction. (Figure 1) In figure 2, The average force of contraction with a standard stimulus was 0.0020±0.0008 among controls, 0.0034±0.0008 among 10% activity and 0.0049±0.0010 among subjects with 20% of activity (P value<0.001). This indicates that increase in intensity of physical activity will lead to higher force of muscle contraction. (Figure 2)
Table 2: Comparison of mean of Threshold of stimulus required for contraction between the study groups (N=60)
The threshold of stimulus required for muscle contraction was comparable in both the intervention groups at the baseline. In both the groups with each round of physical activity, the threshold of required stimulus has declined. The decline was from 12.1 ± 0.88 to 8.13 ± 0.86 in 10% activity group and from 12.3 ± 1.06 to 7.27 ± 1.05 in 20% activity group. The required threshold was lower in 20% group after each round of physical activity with a statistically significant difference with 10% activity group. (Table 2)
Table 3: Comparison of mean of F parameters between the study groups (N=60)
The force of muscle contraction was comparable in both the intervention groups at the baseline. In both the groups with each round of physical activity, the force of contraction has increased. The force of contraction increased from 0.00230±0.0008 to 0.00623±.000858 in 10% activity group and from 0.00223±0.00010 to 0.00823±0.0010in 20% activity group. The force of muscle contraction was higher in 20% group after each round of physical activity with a statistically significant difference with 10% activity group. (Table 3)
DISCUSSION Muscle recruitment and motor patterns are important not only to preserve intra-abdominal pressure but also in lumbo-pelvic stability and all the other biomechanical functions, such as those related to motility.14 In our study we included 90 participants and they were equally divided into three different groups namely Cases (10% of activity), Cases (20% of activity), Controls. The participant in our study groups were young adults (18-25 years). We found that increase in physical activity simultaneously decreased the threshold of stimulus required for muscle contraction. Physiological skeletal muscle contraction requires generation and spread of a membrane action potential, transduction of the electrical energy into an intracellular chemical signal that, in turn, triggers myofilament interaction.15 Another finding we observed was if there was increase in intensity of physical activity this will produce higher force of muscle contraction. Results of a study concluded that level of effort involved in resistance exercise training plays a critical role in determining the amount of strength augmentation.16. It is well known that acute or chronic increases in physical activity result in structural, metabolic, hormonal, neural, and molecular adaptations that increase the level of force or power that can be sustained by a muscle. These adaptations depend on the type, intensity, and volume of the exercise stimulus, but recent studies have highlighted the role of high intensity, short-duration exercise as a time-efficient method to achieve both anaerobic and aerobic/endurance type adaptations.17While comparing the mean of Threshold of stimulus required for contraction and F parameters between the both study groups we found statistical significance. Skeletal muscle tissue is highly plastic and shows a wide spectrum of adaptations towards mechanical and metabolic stress, as induced by physical exercise. To achieve adaptational benefits from exercise training, a variety of skeletal muscle subsystems are involved to orchestrate the complex systemic interactions taking place in skeletal muscle tissues.18
CONCLUSION The average threshold of stimulus required for contraction was higher in control group and gradually declined with increased intensity of physical activity. The average force of muscle contraction was lower in control group and gradually increased with increased intensity of physical activity. In both the intervention groups the required threshold had shown declining trend and the force of contraction had shown increasing trend. The difference in the threshold and force of contraction was statistically significant between 10% and 20% group after each round of physical activity.
REFERENCE
Policy for Articles with Open Access
|
|
||||||||||||||||||||||||||||||||||||||||||||||||||||||||||||||||||||||||||||||||||||||||||||||||||||||||||||||||||||||||
 This work is licensed under a Creative Commons Attribution-NonCommercial 4.0 International License.