 Home
HomeOfficial Journals By StatPerson Publication
|
Table of Content - Volume 6 Issue 2 - May 2018
Comparative study of auditory and visual reaction time in bus drivers and age matched controls
Sunitha M1*, Komal Mankar2, Suresh Y Bondade S3, S V Brid4
Department of Physiology, JJM Medical College, Davangere-577004, Karnataka, INDIA. Email: drsunithadvg@gmail.com
Abstract Background: The time between the application of stimulus and the response is called reaction time.1 Visual Reaction Time and Auditory Reaction Time are considered as ideal tool for measuring sensory motor association and also performance of an individual Aims and Objectives: To study auditory and visual reaction time in bus drivers and age matched controls. Methodology: After approval from institutional ethical committee a cross-sectional study was carried out in the Department of Physiology of at the Medical College in Bus Drivers Group A and age matched Controls Group B. There were totally 60 participants, 30 each in Group A and Group B. The tests were done using Inquisit 4.0 computer software released in 2013 by Millisecond Software in Seattle, Washington The statistical analysis was done by un-paired t -test and calculated by SPSS version 19. Result: Average age in Group A and Group B were comparable with each other i.e. 37 ± 4.51 and 36.5 ± 3.42 (p>0.05). The average VRT in Bus drivers (Group A ) was 223.1 and SD=16.69 and in Age matched controls was 262.5 and SD=17.08, this observed difference was statistically significant (P<0.0001, t=9.0, df=58). The average ART in Bus drivers (Group A ) was 216.7 and SD=11.83 and in Age matched controls was 245.26 and SD=12.74, this observed difference was statistically significant (P<0.0001, t=9.0, df=58) Conclusion: It can be concluded from our study that the VRT and ART were significantly lower in Bus drivers as compared to age matched controls. Key Words: VRT (Visual Reaction Time), ART (Audio Reaction Time), Bus Drivers.
INTRODUCTION The time between the application of stimulus and the response is called reaction time.1 Visual Reaction Time and Auditory Reaction Time are considered as ideal tool for measuring sensory motor association and also performance of an individual. Reaction time has physiological significance and is considered as a simple and non-invasive test for peripheral as well as central neural structures.2 Reaction time is broken down into three parts. 1st: Perception time – i.e. time for the application and perception of the stimulus including giving the necessary reaction to it. 2nd: Decision time - signifies the time for giving an appropriate response to the stimulus.3 rd: Motor time - time for compliance to the order received.3,4 Reaction time depends on several factors i.e. arrival of the stimulus at the sensory organ, conversion of stimulus to a neural signal by sensory organ, transmission and processing of neural signal, muscular activation, soft tissue compliance, and the selection of an external measurement parameter.5 Pioneer reaction time study was done by Donders. He proved that a simple reaction time is shorter compared to recognition reaction time, and choice reaction time is longest of all.6 Previous studies have confirmed that reaction to sound is faster than reaction to light, with mean ART being 140-160 ms and VRT being 180-200ms.7,8,9,10 MATERIAL AND METHODS After approval from institutional ethical committee a cross-sectional study was carried out in the Department of Physiology of at the Medical College in Male Bus Drivers Group A and Age matched Controls Group B. There were totally 60 participants 30 each in the Group A and Group B. The tests were done using Inquisit 4.0 computer software released in 2013 by Millisecond Software in Seattle, Washington. During the visual RT (VRT) task, in the center of the white screen background, the participant gets presented a black fixation cross that is followed after variable time intervals by a target stimulus that is, red circle and the standard procedure was done as per described by Aditya Jain 13. The statistical analysis was done by un-paired t -test and calculated by SPSS version 19. RESULT
Table 1: Age wise distribution of the patients
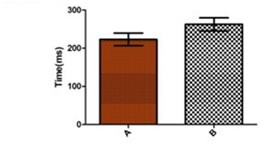
From Table 1 it is clear that the average age in Group A and Group B were comparable with each other i.e. 37 ± 4.51 and 36.5 ± 3.42 (p>0.05) (P<0.0001, t=9.0, df=58,A: Mean=223.1,SD=16.69. B: Mean=262.5, SD=17.08) The average VRT in Bus drivers (Group A) was 223.1 and SD=16.69 and in Age matched controls was 262.5 and SD=17.08, this observed difference was statistically significant (P<0.0001, t=9.0, df=58).
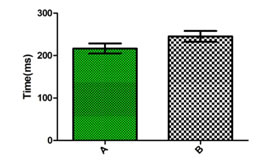
Figure 2: Audotory reaction time in bus drivers and controls (P<0.0001, t=9.0, df=58, A: Mean=216.7, S.D=11.83, B: Mean=245.26, S.D.=12.74)
The average ART in Bus drivers (Group A) was 216.7 and SD=11.83 and in Age matched controls was 245.26 and SD=12.74, this observed difference was statistically significant (P<0.0001, t=9.0, df=58)
DISCUSSION Human RT works by having a nervous system recognize the stimulus. The neurons then relay the message to the brain. The message then travels from the brain to the spinal cord, which then reaches person’s hands and fingers. The motor neurons then tell the hands and fingers how to react. The accepted figures for mean simple RTs for college-age individuals have been about 190 ms for light stimuli and about 160 ms for sound stimuli.11,12 RT in response to a situation can significantly influence our lives due its practical implications. Fast RTs can produce rewards (e.g. in sports) whereas slow RT can produce grave consequences (e.g. driving and road safety matters). Factors that can affect the average human RT include age, sex, left or right hand, central versus peripheral vision, practice, fatigue, fasting, breathing cycle, personality types, exercise, and intelligence of the subject.13 In our study we have seen that The average VRT in Bus drivers (Group A ) was 223.1 and SD=16.69 and in Age matched controls was 262.5 and SD=17.08, this observed difference was statistically significant (P<0.0001, t=9.0, df=58), The average ART in Bus drivers (Group A ) was 216.7 and SD=11.83 and in Age matched controls was 245.26 and SD=12.74, this observed difference was statistically significant (P<0.0001, t=9.0, df=58) From this it is clear that VRT was slower as compared to ART in both the Group, and VRT and ART were significantly less in Bus drivers as compared to their healthy age matched controls, this can be explained due to the reason that bus drivers are experts of driving and it’s a professional requirement at the time of license and another aspect in ours study the age i.e. 37 ± 4.51 Yrs. so the same result at older age cannot be predicted from this study.
CONCLUSION It can be concluded from our study that the VRT and ART were significantly lower in Bus drivers as compared to age matched controls.
REFERENCES
|
|
 This work is licensed under a Creative Commons Attribution-NonCommercial 4.0 International License.