 Home
HomeOfficial Journals By StatPerson Publication
|
Table of Content - Volume 7 Issue 2 - August 2018
Association between television viewing and risk of metabolic syndrome, a community based study
V Shobha Rani1, S Usha Devi2*
1Associate Professor, 2Professor and HOD, Department of Physiology, Government Medical College, Anantapur, Andhra Pradesh, INDIA.
Abstract Background: Metabolic syndrome, a constellation of interconnected physiological, biochemical, clinical, and metabolic factors that directly increase the risk of cardiovascular disease and type 2 diabetes mellitus is becoming an important issue during recent decades and many studies have explored the risk factors contributing to its development. However, less attention has been paid to the risk associated with sedentary behavior, especially television viewing. This study examined the association between TV viewing and risk of developing metabolic syndrome. Materials and Methods: This is a community based cross sectional study done among the 54 urban city dwellers of Anantapur within 2km from medical college. Study was conducted from July 2017 to December 2017. Data was collected using predesigned questionnaire and it was entered and analyzed in MS excel using Chi-square test considering p value <0.05 as significant. Results: Overall prevalence of metabolic syndrome among study subjects was 51.85%, with 46.42% in males and 57.69% in females .Obesity, high intake of junk food, smoking, TV viewing for longer time were found to be associated with increased risk of metabolic syndrome. Conclusion: Increased TV viewing time was associated with an increased prevalence of the metabolic syndrome, while physical activity was associated with a reduced prevalence. Population strategies addressing the metabolic syndrome should focus on reducing sedentary behaviours such as TV viewing, as well as increasing physical activity. Key Word: metabolic syndrome, obesity, physical activity, TV viewing.
INTRODUCTION There is an increase in the worldwide prevalence of metabolic syndrome, with the rate in each country depending on the particular diagnostic definition and the ethnicity of the population. In India and other South Asian countries, prevalence of obesity and metabolic syndrome is rapidly increasing leading to increased mortality and morbidity due to cardiovascular diseases and type 2 diabetes mellitus1,2. Approximately about one third of urban South Asians have evidence of the metabolic syndrome3. Moreover, insulin resistance was observed to be there in nearly 30% of Asian Indian children and adolescents and many exhibit features of metabolic syndrome 4. Since metabolic syndrome and obesity track into adulthood, these clinical entities need to be recognized early in the life-course for effective prevention of T2DM and CVD. As a result of metabolic syndrome becoming an important issue during recent decades, many studies have explored the risk factors contributing to its development. Although the syndrome has often been found to be associated with Socio-demographic and lifestyle factors5-10, less attention has been paid to the risk associated with sedentary behavior, especially television (TV) viewing, that has been reported to increase the risk of obesity and coronary heart disease (CHD)11-17.A few epidemiological studies have examined the effect of TV viewing on the chances of having metabolic syndrome and found that a prolonged viewing time of at least 2 hours per day was responsible for increasing the risk of having metabolic syndrome 1.74–3.30-fold18-21. However, all these studies were conducted on Caucasian populations, and it may be that Asian populations have different risk factors for metabolic syndrome. Therefore, in our study, we examined the association between TV viewing time and the presence of metabolic syndrome.
METHODOLOGY This present cross sectional study was done among urban dwellers of Anantapur from July 2017 to December 2017. Convenient sampling was followed and a sample of 54 was taken from 9 electoral wards, 6 from each ward within 2km from medical college. Inclusion criteria:
Exclusion criteria:
Detailed interviews were performed through a predesigned questionnaire. The questionnaire required participants to provide socio-demographic characteristics and lifestyle details, such as smoking, drinking, leisure activity, and time spent on watching TV every week. After checking for completeness of data, the responses were entered in MS Excel 2007 and subjected to descriptive and inferential statistical analysis. The association between TV viewing and metabolic syndrome was analyzed by using Chi-square test, P value <0.05 was considered statistically significant. Metabolic syndrome definition: Various diagnostic criteria have been proposed by numerous national/international organizations for defining metabolic syndrome22-25. We have followed most recent definition from Joint Interim Statement26 .of the International Diabetes Federation Task Force on Epidemiology and Prevention; National Heart, Lung, and Blood Institute; American Heart Association; World Heart Federation; International Atherosclerosis Society; and International Association for the Study of Obesity and also a Consensus Statement for Diagnosis of Obesity, Abdominal Obesity and the Metabolic Syndrome for Asian Indians 27.As per these consensus statements, three out of five cardiovascular risk factors have to be abnormal for the identification of the metabolic syndrome 26,27. Presence of any three of the following five conditions is essential, i.e.
Physiologically normal range of parameters: Waist circumference: males - <102cm; females - < 80cm Hyper triglycerides: < 150 mg/dl HDL: males- >40mg; females - >50 mg Blood pressure:120/80 mg Fasting blood sugar : 70-110mg/dl Sociodemographic profile: Out of 54 study subjects, majority of them were in the group of 31-40y (33.33%) followed by 51-60y (22.22%),41-50y (20.37%), 61-70y(11.11%) , 20-30y( 7.4%) and >70(5.56%)(Table 1) Among the study participants majority were males (51.85%) while females were of 48.15%.Out of 54 study participants, most of them were from above poverty line (88.89%)
Table1. Sociodemographic profile of study participants
Table 2: Distribution of study participants based on BMI
Among the study participants, majority of males (46.43%) were of overweight while BMI of most (61.54%) of females fall in normal range. Association between TV viewing and Sociodemographic characters: From the below table (Table 2) it can be known that significant association was found between age and TV viewing (P<0.05) i.e. T.V viewing was high among the age groups of 20-40 and 40-60 compared to those above 60 .Also significant association was found between TV viewing and junk food intake, T.V viewing and physical activity i.e. high intake of junk food and low physical activity was associated with longer duration of TV viewing.
Table3. Description of Sociodemographic characters of the study participants with respect to TV viewing.
Prevalence of metabolic syndrome: In the current study, the prevalence of metabolic syndrome among study participants was 51.85% with high prevalence among females (57.69%) when compared to males (46.42%). With regard to age, metabolic syndrome was high among the age groups of 61-70 (66.67%) followed by 51-60 (58.33%).
Table 4: Prevalence of metabolic syndrome among study participants
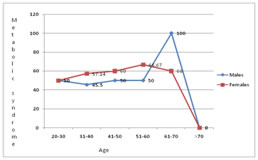
Figure 1: Age specific prevalence of metabolic syndrome in study subject From table 5, it can be understood that in the current study, among males, high triglycerides and central obesity were the commonest abnormalities whereas lowest abnormality was high blood sugar .Similar to males, in females, the commonest abnormality was high triglycerides followed by low HDL and the lowest abnormality was high blood sugar. From table 5, it can be understood that in the current study, among males, high triglycerides and central obesity were the commonest abnormalities whereas lowest abnormality was high blood sugar .Similar to males, in females, the commonest abnormality was high triglycerides followed by low HDL and the lowest abnormality was high blood sugar.
Table 5: Individual components of metabolic syndrome in the study subject
Predictors of metabolic syndrome: In the current study, among all the Sociodemographic characters, prolonged TV viewing, smoking, high junk food intake, low physical activity, high BMI significantly contributed to increased risk of metabolic syndrome among study population Table 6: Predictors of metabolic syndrome among study subjects
P<0.05* significant DISCUSSION The present study was done to assess the association between TV viewing and metabolic syndrome among the residents of Anantapur residing within 2km from medical college. In the current study, the prevalence of metabolic syndrome was 51.85 % whereas in D.S .Prasad et al study 28, the prevalence was 33.5%. The prevalence of metabolic syndrome is increasing exponentially in India, both in the urban and rural areas. It has escalated in different parts of India to figures now ranging from 11% to 41%29 .The differences in the prevalence of metabolic syndrome between studies from Indian subcontinent may be attributed to different criteria employed, different age groups included, and different rates of prevalence of individual components of the metabolic syndrome. In the current study, there was no significant gender difference in the prevalence of metabolic syndrome (P<0.05) whereas in D.S.Prasad et al study 28, Women (52.2 %) had significantly higher rates of metabolic syndrome compared to men (34.2 %). The prevalence of metabolic syndrome was found to be increasing with age with high prevalence in the age group of 61-70 similar to D.S.Prasad et al study 28 wherein people above 65years age have five fold increased risk of metabolic syndrome. Coming to the individual components of metabolic syndrome, low HDL and high triglycerides were commonest abnormalities found among both the genders. Low HDL could be high central obesity found among the study population It was found in the current study that both men and women who on average spent more than 14 hours per week watching television had a significantly higher risk of having metabolic syndrome than those who spent less than 14 hours per week doing so. Similar association was found in the Dunstan et al study 30 and Chang et al study 31.The high risk association between TV viewing and metabolic syndrome could be due to reason that TV viewing replaces physical activity which in turn leads to decreased energy expenditure. Other Sociodemographic characters like smoking, high junk food intake, low physical activity, high BMI were also significantly associated with metabolic syndrome in the current study whereas in D.S Prasad et al study28, Older age, female gender, general obesity, inadequate fruit intake, hypercholesterolemia, and being middle-to higher Socioeconomic status significantly contributed to an increased metabolic syndrome risk among the study population.
CONCLUSION In conclusion, in the current study it was found that excess TV viewing had an adverse effect on metabolic syndrome, a finding that was statistically significant. Metabolic syndrome was also found to be high among those with low physical activity and high junk food intake. So the current study reveals that life style factors affect the normal physiological characters. Hence, to reduce the prevalence of metabolic syndrome and its components, it may not only be important to increase participation in physical activity, but also to reduce leisure time activities like time spent watching TV, using mobile phone/computer etc .
REFERENCES
|
|
|||||||||||||||||||||||||||||||||||||||||||||||||||||||||||||||||||||||||||||||||||||||||||||||||||||||||||||||||||||||||||||||||||||||||||||||||||||||||||||||||||||||||||||||||||||||||||||||||||||||||||||||||||||||||||||||||||||||||||||||||||||||||||||||||||||||||||||||||||||||||||||||||||||||||||||||||||||||||||||||||||||
 This work is licensed under a Creative Commons Attribution-NonCommercial 4.0 International License.