 Home
HomeOfficial Journals By StatPerson Publication
|
Table of Content - Volume 8 Issue 2 - November 2018
Study of correlation between serum uric acid and fasting blood glucose in type 2 diabetics, their healthy offspring’s matching with healthy controls
G Manogna1, Mohammed Jaffer2*
1MBBS Third Year Student, 2Assistant Professor, Department of Physiology, GSLMC, Rajamahendravaram, Andhra Pradesh, INDIA. Email: mdjafferkp@gmail.com
Abstract Background: Diabetes Mellitus (DM) is one of the most common disorders which is spreading like rapid fire both in developed and developing countries. In our study, we are testing the hypothesis, that serum uric acid (SUA) acts as an independent risk factor for the development of type 2 DM. There are few studies that show clearance of SUA is decreased with increase in insulin levels and also there is a positive correlation between SUA levels and fasting blood glucose (FBG) levels leading to the development of type 2 DM. Objectives: 1Correlate between SUA and FBG in type 2 DM patients. 2) Compare and correlate between SUA and FBG in healthy offspring’s of type 2 DM parents and in healthy age matched individuals whose parents are not suffering from type 2 DM. Methodology: 50 type 2 DM patients and their 50 healthy offspring’s as cases (either of the parents diagnosed as type 2 DM) matching with 50 healthy offspring’s (controls) whose parents were non diabetic were randomly selected for this case control study. Investigation of FBG level by Trinder’s method and SUA by Uricase method. Student’s t-test and Pearson correlation test was done. Results: Cases and controls were perfectly matched according to their age and genders. Positive correlation of SUA with FBG in Type 2 DM patients found to be significant (r=+0.42, p=0.001) and also in cases was significant (r=+0.29, p=0.03).Conclusion: The result of positive correlation between SUA and FBG in the offspring’s of type 2DM suggests that SUA acts as an independent risk factor apart from the other risk factors like obesity etc. Reducing the uric acid levels with medications can help in preventing the occurrence of insulin resistance leading to type 2 DM in the healthy offspring’s of type 2 diabetic parents. Key Word: Serum uric acid, Fasting blood glucose, Diabetes mellitus.
INTRODUCTION Diabetes mellitus is considered as one of the most common non communicable diseases with multifactorial causes in the world. Diabetes mellitus (DM) is a metabolic disorders consisting of high levels of glucose in blood associated with disturbance of fat and protein metabolism due to absolute or relatively low levels of insulin secretion or its action. International Diabetes Federation report estimates, around 415 million people had DM in 2015 and this is going to increase to 642 million by 2040. India had 69.1 million people with DM and is estimated to have the second highest number of cases of DM in the world after China in 2015.1 There are many independent risk factors for the development of type 2 DM like age, body weight, sedentary lifestyles etc. Recent studies showed that increased uric acid levels in blood might act as an independent risk factor for development of type 2 DM, which is still debatable. Uric acid is formed by the breakdown of purine and by direct synthesis from 5-phosphoribosyl pyrophosphate and glutamine. Serum urate levels vary with age and sex. In adulthood, concentrations rise steadily over time and vary with height, body weight, blood pressure, renal function and alcohol intake.2,3 Hyperuricemia, the precursor of gout, is strongly associated with insulin resistance syndrome, an established risk factor for type 2 diabetes.4 Studies have reported that elevated serum uric acid (SUA) levels precede the development of obesity, hyperinsulinemia and diabetes.5 There are few studies that show clearance of SUA is decreased with increase in insulin levels and also there is a positive correlation between SUA levels and fasting blood glucose(FBG) levels leadingto the development of type 2 DM. Further studies indicate that SUA can act as both pro-oxidant and anti-oxidant. SUA plays a major role as a pro-oxidant in oxidative stress leading to insulin resistance. Few studies are done in the adolescent group regarding the association between hyperuricemia and development of type 2 DM.6 Hence the present study is done to assess any correlation existing between SUA and FBG in type 2 diabetics, their healthy offspring’s and matched with healthy controls so that to provide proper necessary preventive measures for future risk of DM in the healthy offspring of type 2 Diabetics. 50 type 2 DM patients and their 50 healthy offspring’s (either of the parents diagnosed as type 2 DM) matching with 50 healthy offspring’s whose parents were non diabetic were randomly selected for this case control study. In our study cases were represented by 50 healthy offspring’s of 50 type 2 DM parents. Among cases 40 females and 10 males were randomly selected whose parents were suffering from type 2 DM since 1-5 years without any complications of DM. These cases were compared with their age and gender matched controls [40 females and 10 males] whose parents were not suffering from type 2 DM. Study was done between May to October 2017. Inclusion criteria: Type 2 DM patients suffering for less than 5 years with no complicationsHealthy offspring’s of Type 2 DM parents in the age group of 17-25 yearsHealthy age and gender matched controls whose parents are non diabetic Subjects who gave voluntary consent. Exclusion criteria:Any family history of cardio-vascular diseases like hypertension, coronary artery disease, stroke. Any family history of metabolic disease like type 1DM, GOUT, Metabolic syndrome.SmokersAlcoholicsAny family history of respiratory diseases, renal diseases, endocrine disorders, tumours and CNS disorders.Institutional ethical clearance was obtained from the GSL Medical College, Rajamahendravaram, Andhra Pradesh, before conducting the study. History of personal, family and diet were taken from the patients and subjects. The anthropometric parameters like height (cm), weight (Kg), BMI (Kg/m2) according to Indian scale, BSA (m2) by Dubois nomogram, Waist-Hip ratio were taken. The physiological parameters like pulse rate, Systolic and diastolic blood pressure by mercury sphygmomanometer method was taken by both palpatory and auscultatory method. Before taking the blood sample, instructions were given to the patients and subjects regarding 8 hour overnight fasting and collected the venous blood samples under aseptic precaution at Central Laboratory of GSL Medical College and Hospital. Biochemical investigation of FBG level by Trinder’s method (Glucose oxidase – Peroxidase) and SUA by Uricase method (Peroxidase) Trinder’s method for FBG: Glucose is oxidised to yield gluconic acid and hydrogen peroxide in the presence of glucose oxidase. The enzyme peroxidase catalyzes the oxidative coupling of 4-aminoantipyrine with phenol yielding a coloured quinonimine complex with absorbance proportional to the concentration of the glucose in the blood.12 Uricase method for SUA: Enzymatic assays for uric acid in serum uses a peroxidase system coupled with one of a number of oxygen acceptors to produce a chromogen, and the intensity of this colour is red at 440nm.13 Statistical analysis: The results were expressed in terms of mean ± standard deviation. Student’s t-test was applied for this case control study to study the significant association by knowing the p- value. Pearson correlation test was done to know the relation between SUA and FBG levels. Latest statistical SPSS software version 21, Microsoft word and Microsoft Excel of Windows 7 were used for drawing the results.
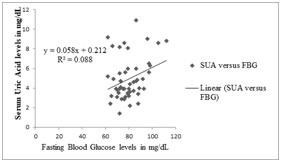
RESULTS In this study cases and controls were perfectly matched according to their age and genders. Table -1 shows the Pearson correlation of SUA with FBG in Type 2 DM Patients. Result found to be a positive correlation which is highly statistical significant. As serum uric acid concentration increases there is an increase in the fasting blood glucose levels in the type 2 DM patients.Table-2 shows the mean± SD of SUA and FBG in the Type 2 DM Patients stating that they are suffering from hyperuricemia and hyperglycaemia.Table 3 and 4 shows the basic comparison of anatomical and physiological parameters between the cases and controls. As such there were no statistical differences of the anatomical and physiological parameters between the two groups.Table -5 shows the comparison of SUA and FBG between cases and controls and found that there was no statistical differences present in these parameters in the two groups of studyTable-6 shows the Pearson correlation of SUA with FBG in Cases and Controls. It shows a positive correlation between SUA and FBG in cases which is statistical significantand no correlation between SUA and FBG in controls.Figure-1 depicts the positive correlation between SUA and FBG in cases which is statistical significant. As serum uric acid concentration raises there is an increase in the fasting blood glucose levels in the same offspring’s of the type 2 DM patients who were showed a positive correlation in Table-1
Table 1: Pearson correlation of SUA with FBG in Type 2 DM Patients
SUA: serum uric acid, FBG: fasting blood glucose + Positive correlation ** Highly statistical significant
Table2: Values of SUA and FBG in Type 2 DM Patients
SUA: serum uric acid, FBG: fasting blood glucose, SD: Standard Deviation
Table3: Comparison of anatomical parameters between two groups.
BMI: Body mass index, BSA: Body surface area, SD: Standard Deviation Table 4: Comparison of physiological parameters between two groups.
RR: Respiratory rate as cycles per minute, PR: Pulse rate as beats per minuteSBP: Systolic blood pressure, DBP: Diastolic blood pressure
Table 5: Comparison of SUA and FBS in two groups
SUA: serum uric acid, FBG: fasting blood glucose Table 6: Pearson correlation of SUA with FBG in Cases and Controls
+ Positive correlation; *Statistically significant Figure 1: Pearson correlation between SUA and FBG DISCUSSION According to the previous studies, it has been postulated that serum uric acid acts as an independent risk factor for developing insulin resistance, obesity and even hypertension. In our study, the fact that there was a positive correlation between SUA and FBG in the Type 2 DM patients who were not suffering from any complications as shown in Table 1 coincides with results obtained from the studies done by Bhole V4et al, a prospective study using the datasets obtained from the National Heart, Lung and Blood Institute (NHLBI) and Andrade JAM7et al, a cross-sectional observational study in Brazil.There are very few studies done on the healthy offspring’s of the type 2DM parents, to know whether there is an association between these 2 parameters i.e. SUA and FBG and whether the SUA acts as a biochemical screening marker in them for preventing type 2 DM. In our study, there was a positive correlation between SUA and FBG in cases as shown in Figure-1. This finding is supported by the study done in Ballari, Karnataka, South India, done by Sandhya HP11et al and the similar finding exists in the study done by Ford ES et al, among US children and adolescents.The result of positive correlation between SUA and FBG in the offspring’s of type 2DM suggests that SUA acts as an independent risk factor apart from the other risk factors like obesity etc. In the present study, there was no statistical differences seen among the parameters like age, BMI, BSA, waist and hip circumference, waist/hip ratio, pulse rate, blood pressure, respiratory rates, SUA and FBG between cases and controls unlike seen in other study done by Sandhya HP 11et al.Hyperuricemia may cause endothelial dysfunction and decreased production of nitric oxide, which leads to insulin resistance and thus diabetes.14 This is given evidence by conducting studies on fructose-induced hyperuricemia rats causing insulin resistance along with other components of metabolic syndrome, and this is managed by decreasing uric acid levels.14, 15 Further studies shows elevated serum acid levels might cause prediabetes status at the renal level. Higher insulin levels with prediabetes can decrease renal excretion of uric acid, 16-18 as insulin can stimulate the urate-anion exchanger19 and the sodium dependent anion co-transporter in brush border membranes of the renal proximal tubule20 and increase renal urate reabsorption. Strength of the present study: simple cost effective biochemical test like uric acid is used, which can guide to diagnose the impaired glucose tolerance leading to insulin resistance. Uric acid level can also guide as a marker of cardiovascular disease which is the commonest cause of mortality in diabetes mellitus. The limitations of the present study include short sample size, other biochemical parameters which support the DM like serum triglycerides, cholesterol, blood urea, serum creatinine, insulin levels, leptin and other inflammatory mediators like C reactive protein levels not assessed.21
CONCLUSIONS The present study has shown a positive correlation existing between SUA and FBG levels in both the parents who are type 2 diabetics and in their healthy offspring’s. But when they were compared to controls, we didn’t find any statistical differences in BMI, BSA, Waist/hip ratio, pulse rate, blood pressure, SUA and FBG, which indicates that even though the offspring’s of type 2 diabetics were not suffering from hyperuricemia and hyperglycaemia but there was a positive correlation between these 2 factors that might lead to insulin resistance like occurred in their parents. Further large sample study with other investigations like insulin, leptin levels should be assessed to know the strength of this positive association. From this study we conclude that by reducing the uric acid levels with medications can help in preventing the occurrence of insulin resistance leading to type 2 DM in the healthy offspring’s of type 2 diabetic parents.
ACKNOWLEDGEMENTS This research was carried out under the Short term studentship (STS) Program of Indian Council of Medical Research (ICMR) having a reference ID: 2017-03520 and got approved on February 2018. We would like to thank the ICMR, Dean, Principal, HOD of Physiology, GSLMC management for giving the opportunity to conduct the study. We also like to extend the thanks to Dr Sandhya HP, Assistant professor, VIMS, Ballari with whom this study was done and got published in NJBMS on 2015.
REFERENCES
|
|
|||||||||||||||||||||||||||||||||||||||||||||||||||||||||||||||||||||||||||||||||||||||||||
 This work is licensed under a Creative Commons Attribution-NonCommercial 4.0 International License.